3D holograms! Me want!!
Last time I introduced you to the idea of a time-space diagram, which is a kind of map used to describe motion. As with many maps and diagrams, we choose to use a flat, two-dimensional representation. Someday hologram technology may advance to casual use of three-dimensional images, but so long as we use paper and display screens, we’re stuck with two.
Motion is movement in both space and time, so we want to use one of our two dimensions to represent time. That leaves us with only one remaining dimension for space, so our diagrams exist in a reduced one-dimensional world.
Today I’ll explore that world in more detail.
Let’s suppose Al and Em (and Max) are in a very narrow hallway that allows movement only along the length of the hallway. (We can also suppose the hallway has a low ceiling that prohibits jumping up and down.) Essentially, this hallway is one-dimensional — as far as physical movement is concerned, it only has length.
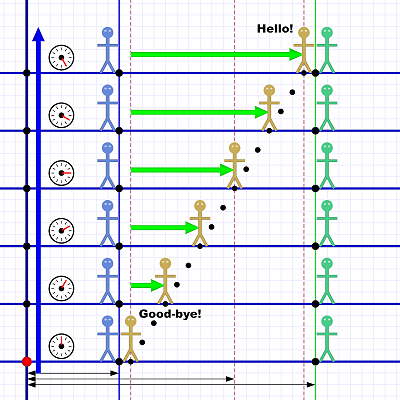
Diagram 1. Max walks from Al to Em.
We’re seeing the hallway from one side. From our perspective, Al stands near the left end, and Em stands some distance away to the right.
As our diagram-story begins, Max is standing next to Al, just to his right. Remember that these diagrams begin at the bottom and progress upwards. Time flows from bottom to top; the large blue arrow to the left helps emphasize and remind us of that.
And Happy (belated) Birthday!
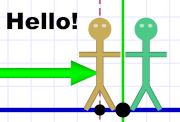
In the scenario, Max says “Good-bye!” to Al and walks down the hallway to say “Hello!” to Em (it was her birthday yesterday).
The diagram shows us six snapshots of Max’s progress, but keep in mind the scenario is actually continuous.
This diagram packs a lot of important concepts into a single image:
¶ The six horizontal blue lines represent the hallway in each of the six snapshots. The stick figures shown are symbolic — intended to help visualize the situation and keep the players straight.
Their actual positions are represented by black dots on the horizontal lines. (Max has some extra dots I’ll explain below.)
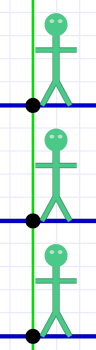
Motionless Em.
¶ Al and Em don’t move during all this, so their dots never change position within the hallway (they don’t move left or right on the snapshot lines). The vertical lines (blue for Al, green for Em) show their continuous movement through time.
Since the lines are strictly vertical, we know that Al and Em have no movement in physical space.
The vertical dashed gold lines show Max’s position at three moments during the scenario: the start, the end, and a selected point along the way. These dashed lines show Max’s position in the hallway at a given moment.
¶ Max’s movement is shown with extra dots between the snapshots. The diagram could have included more snapshots, but since Max is the only thing moving, it would have been a lot of snapshots with little added effect.
The extra dots mainly help make the point that Max also has a continuous motion line (not explicitly drawn), and his line — since it is slanted — moves both in time and in space.
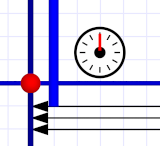
¶ On the far left is another series of dots, the big blue arrow, and images of a timer. As mentioned above, the big blue arrow emphasizes that time moves upwards on the diagram.
The timer also helps to make that point. It shows us that each snapshot occurs on the tick of the timer. We can use that time interval to calculate Max’s speed.
Origin of time and space.
¶ In the lower left is a red dot. This is our origin, or reference point. Any measurements we make, in space or time, are relative to the origin.
Arrows along the bottom show distance measurements to Al, to Em, and to the selected position along Max’s walk. If the grid squares represent floor tiles, we can say Al stands 8 tiles from the origin, Em stands at 25 tiles, and Max — at the moment we measure him — is at 18 tiles.
These numbers are their spatial coordinates!
¶ The red dot is also a time marker; call it time zero (or as we’ll see it in many of the diagrams to come: t=0).
The bottom snapshot, which includes the origin, has a time coordinate of zero. The one above it has a time coordinate of 1 tick. Each snapshot has its own time coordinate.
¶ The large green arrows shows the distance Max covers increasing as time progresses. The total distance he covers (15 tiles), and the time he takes to cover it (5 ticks), give us his speed: 15 ÷ 5 = 3 tiles per click.
As I said, there’s a lot packed into this one diagram! Here’s a more abstract version that does away with most of the visual aids:
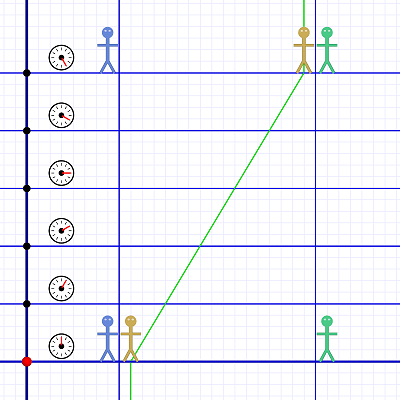
Diagram 2. A more abstract version of Diagram 1.
There are some other changes intended to move us along the path to the diagrams we’ll be using:
¶ Em’s time-space line is blue. In the future, I’ll generally use blue to indicate things that are not moving within a frame. That’s why Al’s stick figure is blue — he’s usually the observer a wider view might consider the non-moving one (such as watching a passing train).
¶ Max now has a time-space line indicating his motion. It’s green to indicate he’s the one moving. (Usually Em will be the “moving” one; that’s why her stick figure is green. Max is just an occasional guest star.)
¶ I added vertical segments to Max’s line to show that he was standing motionless next to Al until time zero when he began to move. Once he reaches Em, he again stands still (chatting with Em).
¶ To de-emphasize the idea of “snapshots” most of the dots are gone, and the horizontal lines are thinner — except the bottom one which is the t=0 line. Our diagrams actually deal with continuous motion, so it’s important to move past the idea of snapshots.
And that’s all for this time. If you understand diagram 2 then you are ready for what’s coming! If you don’t, you definitely want to ask some questions before proceeding.
Next time, I’ll start using these diagrams to explore motion and events that occur in a given frame of reference.


March 24th, 2015 at 6:14 pm
Thanks Wyrd. An excellent job explaining how these diagrams work.
This looks like it took a lot of work, which I for one very much appreciate. I’m curious what software you used for it, if you’re comfortable discussing it. I’ve been trying to find a good package to use for diagramming. I use Visio at work but I’d have to run in a virtual machine to use it on my Macbook.
March 24th, 2015 at 7:26 pm
Thank you; I’m glad it’s all making sense. Hopefully everyone else is following along, too!
The diagrams (and the analysis of SR) was what I was busy with when I took a break from posting this past January. For all their 2D-ness, I used a freeware 3D ray-tracing program I found many years ago, POV-Ray. You write “scene description” files in a language vaguely resembling C. You have variables, selection, and iteration, so you can write “code” that builds objects (especially handing for repeated elements).
I’ve written a number of posts introducing it (here, here, here, and here 🙂 ).
I’ve used it to build a very accurate TARDIS (which was actually fairly simple) and a fairly good NCC-1701 Enterprise (which wasn’t).
Considering various other tools available, it’s pretty low-level. If you check out at least the first of the introduction posts, you’ll see what I mean. It’s a “ship in the bottle” kind of hobby for me, although every once in a while it comes in really handy.
March 24th, 2015 at 7:37 pm
Sorry: the second POV-Ray introduction post (this one) will give you a flavor of the product.
March 24th, 2015 at 8:11 pm
Thanks for the info! I’m not sure if I’m up for the learning curve on it. Which makes me all the more impressed with your work here.
March 24th, 2015 at 10:20 pm
Thanks! The learning curve is a bit formidable. I’ve been mucking around with it for over 15 years. It’s not something you’d want to do for any near-term projects. Maybe just an idea to keep in your hip pocket if you find yourself casting around for an interesting project and want to explore 3D modeling and ray-tracing.
March 27th, 2015 at 3:34 pm
The clock with the explanation of the timer, helped me a lot with this one!
March 27th, 2015 at 5:10 pm
Judging by the timestamps on your comments, you appear to be reading them backwards. Since each post builds on previous ones, that’s got to be a bit confusing!