 Last week I introduced you to the idea of relative motion between frames of reference. We’ve explored this form of relativity scientifically since Galileo, and it bears his name: Galilean Relativity (or Invariance). Moving objects within a (relatively) moving frame move differently according to those outside that frame.
I also introduced you to the idea that light doesn’t follow that rule; that light moves the same way to all observers. This is what makes Special Relativity different. It turns out that, if a frame is (relatively) moving fast enough, some bizarre things happen.
Time-space diagrams will help us explore that.
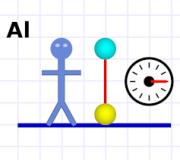 Last week I used diagrams with stick figures representing our friends Al and Em (and Max).
And, by the way, Happy Birthday to Emmy Noether, one of the great mathematicians of the modern era!
These diagrams were two-dimensional. They had a left and right (one dimension) plus they had an up and down (the second dimension).
Unlike our physical three-dimensional world, the diagrams lacked the third dimension of back and forth. Our stick figures were stuck in two dimensions.
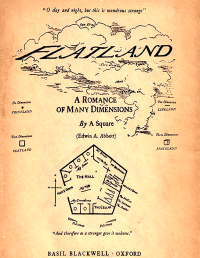
If you’re familiar with Edwin Abbott’s Flatland, our friends there lived in a region of Flatland (if you’re not familiar with Flatland I highly recommend it — it’s political satire wrapped up in a pretty cool geometry lesson).

I was really tickled to see Futurama get in on the Flatland fun!
The previous diagrams did have a kind of time component. Moving balls had lines or arrows representing their motion through the flat space. Some diagrams had a “stopwatch” to show the elapsed time of that motion.
What we need now is a way to precisely diagram motion.
Any motion has a speed, and you’ll recall that speed involves a distance and a time. So what we really need is a way to diagram distance and time.
Suppose we flew from San Diego to Denver, and that trip took three hours:
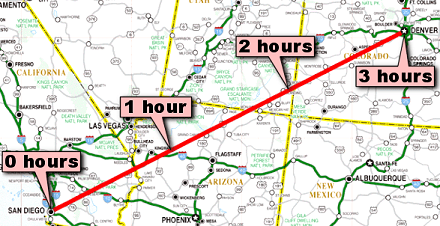
San Diego to Denver in three hours (on a rather slow plane).
One way we might diagram that motion is by using a map, drawing a line to represent our motion across the map, and sticking on some signposts to indicate the passage of time.
If we drove to Denver, we could draw a line that followed the path of the highways we used and again include signposts to indicate how long we’d been driving.
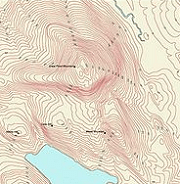
Contour map
Most maps are flat, so they reduce the 3D world to two dimensions, typically north-south and east-west. Some maps include indicators — shading or contour lines — to give us a feel of the missing up-down third dimension.
Unless we’re hiking (or perhaps biking), we often don’t care about the vertical dimension, so we sacrifice it to focus on the two horizontal dimensions we do care about.
On a road trip, we care about the twists and turns of the highway (as well as the type of highway), so a regular map is very useful. But when we fly, we can ignore all that and take a straight line: “As the crow flies.”
If we can view our trip to Denver as having one dimension, we can diagram that as a straight line with San Diego on one end and Denver on the other (even a road trip could be abstractly represented this way if we chose to ignore the path of the highway).
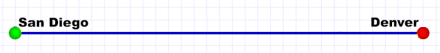
San Diego to Denver in one dimension (distance).
We could use our signposts to indicate time, but, when using only one physical dimension, two-dimensional diagrams have a free dimension! If our sole physical dimension is left-right, we can use up-down to indicate time:
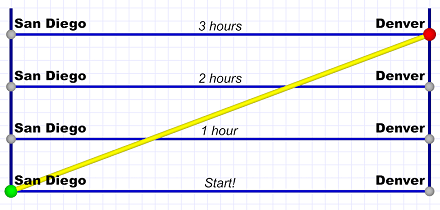
San Diego to Denver in one physical dimension + one time dimension.
Important: Note that time progresses upwards here. That may feel a little unnatural to your sense of a page reading downwards, but it is standard in the type of time-space diagrams we’ll be using.
In particular, do not confuse the upward slant here with the upward slant of the trip in the first diagram! There, the upward slant indicates moving to the north (as well as east). Here, the upward slant indicates moving (forward) in time (as well as moving closer to Denver).

Fast, but not instantaneous.
Very Important: The four horizontal blue lines are not the trip! The yellow line is the trip. The green and red dots symbolize “go” from San Diego and “stop” in Denver.
Remember that time progresses upwards. Therefore, horizontal lines represent an instantaneous trip between cities — one that takes no time at all! (As fast as it is, not even light can do that. As you’ll see later, even light moves at a slant on these diagrams.)
Horizontal lines here indicate things that exist in different places at the same time. (This is going to be extremely important later, so be sure this sinks in!) San Diego and Denver exist at the same time, but in different physical places.
Also Important: Each city has four dots representing it. Those dots, and the four horizontal lines, represent “snapshots” taken every hour. The signposts we used originally are essentially the same thing.

Here today; here tomorrow.
The vertical blue lines symbolize each city in its continuous trip through time. Cities don’t move physically (relative to each other), so there is no left or right movement for them on the diagram.
But they do move through time. They were there yesterday, they’re here today, we assume they’ll be here tomorrow.
Summary
That’s all I want to cover today. It’s Monday, so I want to ease into this. I’ll pick up again tomorrow, and we’ll dig into a bit more detail. You need to be comfortable with these diagrams because they’ll be crucial for the rest of the series.
The key points are:
- The time-space diagrams I’ll be using reduce physical space to a single dimension, somewhat as most maps reduce it to two.
- Left and right represent that single physical dimension.
- Points on a horizontal line represent different places in physical space, but at the same time.
- Points on a vertical line represent different times for the same physical location.
- Upwards on the diagram is forwards in time, so diagram time begins at the bottom and ends at the top.
- Motion always occurs as an (upward!) slanted line, because motion involves movement in both space and time.
That’s it for now. Class dismissed!


March 23rd, 2015 at 6:27 pm
I enjoyed being part of the class, W.S. You are a patient teacher giving us lessons on things we should know by now, but usually don’t! I loved the flat people in the future, the map to travel by and the contour map, too. The old, golden tan cover of Flatland was really nicely illustrated.
March 23rd, 2015 at 6:55 pm
It might be pushing it to say that everyone ought to know all these things by now. We’re definitely in the territory of mathematicians and physicists! That’s exactly why I am taking it so slowly and in hopefully bite-sized chunks.
Have you ever read Abbott’s Flatland? It’s not uncommon to see it in high school math classes — I think that’s where I encountered it for the first time.