 A couple of readers have asked about the diagrams in this series of Special Relativity posts. I created them with the freeware 3D ray tracing application, POV-Ray. The diagrams are actually three-dimensional “scenes” designed to be viewed as flat pieces. If some of the “dots” look more like little spheres, that’s because they are!
I wrote some introductory posts a while ago (here, here, and here). You can read those if you want more details about the application.
For a little (optional!) Friday fun, I thought I’d share some POV-Ray images that have a bit more “dimension” to them.
This is a set of images I made to illustrate how we reduce three-dimensional space down to a single distance dimension for our time-space diagrams. Given all we’ve talked about this week, hopefully this will all make perfect sense to you!
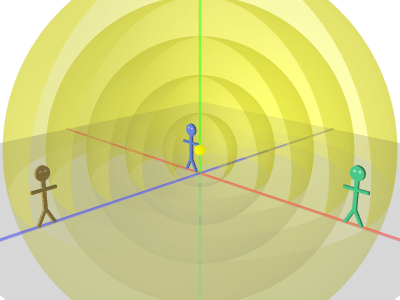
Diagram A. The 3D world with Al (center), Em (right), and Max (left). Al is holding a flashing lamp (the small yellow ball).
Al stands in the center holding a flashing lamp. Em and Max each stand at a distance from him at 90-degree angles. Each flash of the lamp creates a sphere of light expanding away from the lamp (at light speed).
The floor is glass to show the spheres. A big wedge is cut in the part of the spheres facing us to let us see their structure more easily and to make their position in space more apparent.
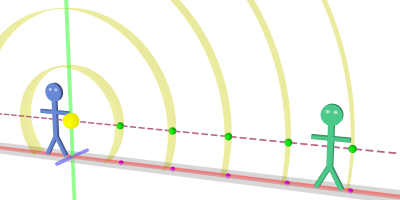
Diagram B. Al and Em in 2D Flatland. Max didn’t make the cut!
We slice off the “to and fro” direction in order to reduce the world to two dimensions. (This, unfortunately, excludes Max.) Now the flashes are rings of light expanding away from the lamp (like what you get if you drop a pebble in a pond).
The dashed line indicates the line of space-time events of interest to us. Green dots along that line mark the position of light flashes moving towards Em. The flashing lamp is the point in space we’ll call x=0.
A truly 2D world would be less than paper-thin (even paper has a thickness), but here I left some depth to help the visualization.
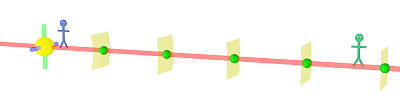
Diagram C. Now we’re down to a 1D world!
Now we chop off the “up and down” direction to reduce the world to 1D — a single dimension of distance. We’re only showing the light moving towards Em. The light rings are now just “pulses” of light. Green “event” dots depict their position.
Al and Em are just icons shown to indicate their relative positions. This is always the case in these diagrams. Their world lines are their true positions. Using actor-observers gives us friendlier names to use than the anonymous “A” and “B” (it is a bit of a shame Ms. Noether wasn’t a “Beatrice” — “Al and Be” would have been awesome).
A truly 1D world is just a line, but a bit of both excluded dimensions is again included for visualization’s sake.
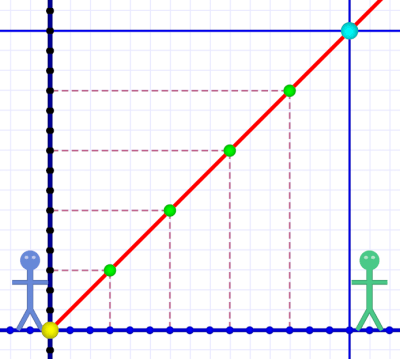
Diagram D. A time-space diagram of the situation.
Here’s how we use a time-space diagram to depict the light going from Al to Em. The yellow dot represents the lamp, the cyan dot represents the event of Em detecting a flash.
The vertical line next to Al is the lamp’s world line (the position of which we’re calling x=0). The lamp isn’t moving, so its world line is strictly vertical.
Likewise, the vertical line next to Em represents her motionless position some distance from the lamp. Technically, it represents the position of whatever detects the light flashes — her eyes or a light detector she’s holding. Regardless, Em isn’t moving, so her world line is also strictly vertical.
The green dots again represent flashes on their way towards Em. The dashed lines show how each of these has a t (time) coordinate and an x (space) coordinate that can be measured.
Remember that a horizontal line indicates a “snapshot” of time, so each green dot represents a flash’s location at that moment in time. Alternately, a vertical line indicates a position in space, so each dot also represents when a flash was located at that position.
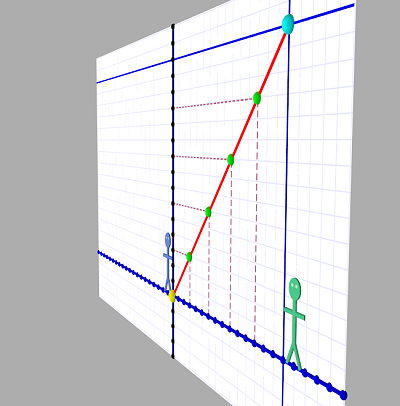
Diagram E. The 3D reality of the above diagram!
Lastly, here’s what that time-space diagram looks like if we move the “camera” way to the right (and closer to the diagram).
You can see how the dots are actually spheres and that Al and Em have a little bit of physical depth. In fact, the lines are actually little rods, although that’s hard to tell in this image.
If you’re interested in seeing more of what POV-Ray can do, you can check these projects of mine:
- The NCC-1701 Enterprise (Kirk’s original Star Trek ship).
- The TARDIS (from Doctor Who).
- A theatre I made for two posts about light and color.
- The light & color posts: Part 1 and Part 2
Or you can just browse the posts with the POV-Ray tag.


March 30th, 2015 at 2:11 pm
These are awesome! I’m especially amazed by the 3D of the 1D.
March 30th, 2015 at 2:45 pm
Thanks; I’m glad you enjoyed them! I’m not sure how *helpful* they are, but they’re fun to look at.
I originally thought of using a “paint shop” app (mine is actually called “Paint Shop Pro”) and making 2D drawings on a background image of graph paper. But POV-Ray has its own programming language, and some of the diagrams benefited from being “active” (algorithmic in construction).
[Hmmm. Note to self: a post on algorithmic information — data that is code — might be an interesting topic.]
March 30th, 2015 at 3:35 pm
LOL…I was lost after “programming language”. 🙂
March 30th, 2015 at 11:59 pm
Think of the difference between the plans for a bookshelf and instructions telling how to make one.
The former is a description of the bookshelf — a type of map or representation. The bookshelf is seen to exist within the plans. The end result is a bookshelf built to the plans — a concrete realization of an abstract design.
Instructions are a series of steps. No image or representation of the bookshelf exists in the steps, and the steps only make sense as an ordered series. The end result is a bookshelf built according to a directed process.
Same bookshelf, different ways of storing the information about it.
March 31st, 2015 at 9:44 am
Ah, once again, a brilliantly simple way of explaining something. Were you ever a teacher?
March 31st, 2015 at 2:10 pm
[blush] Thank you!
In fact, my family tree is filled with preachers and teachers. Seriously. Filled! … Mother, father, sister, cousin, a couple of uncles, several aunts, some nieces and nephews, and a grandfather. ‘S a lot.
Me, I spent several years teaching at a corporate level — mostly internally, but some customer training, too. Plus a fair bit of informal teaching or mentoring. And a lot of technical writing. (How embarrassing would it be if I still really sucked at it! XD )
Still. I have a buddy who sometimes puts me to shame finding the perfect summary of a concept. “Science proceeds despite scientists,” is a perfect-summary line of his regarding the process and philosophy of science. His demonstration of how, Yes, the Moon does rotate even though it also always faces the Earth, is brilliantly simple. Mine was close, but missed the purity his had. My buddy did convince his doubter; I never did mine.
So it’s a learning curve I’m always climbing!
August 9th, 2023 at 7:53 pm
[…] one can fit in. (And back then, the diagrams I wanted to make would have been a challenge with the tool I was […]