 Speaking of Special Relativity, back when I wrote the SR series, one topic I left along the wayside was the concept of the spacetime interval. It wasn’t necessary for the goals of the series, and there’s only so much one can fit in. (And back then, the diagrams I wanted to make would have been a challenge with the tool I was using.)
But now that we’re basking in the warm, friendly glow of March Mathness and reflecting on Special Relativity anyway, it seems like a good time to loop back and catch up on the spacetime interval, because it’s an important concept in SR.
It concerns what is invariant to all observers when both time and space measurements depend on relative motion.
Recall that, if someone is moving relative to you, then to you their clock appears to run slower than yours, and they also appear foreshortened along the direction of their motion.
The “relativity” part of this is that, to them, you appear to be moving relative to them, and so they think your clock is slower and that you’re foreshortened.
All things being equal, both of you are correct. It’s only when one of you enters the frame of the other that the situation resolves.
So, if length and time are relative, other than the speed of light, is there anything all observers can agree on?
There is, and it’s called the spacetime interval. It is a special combination of distance traveled and time elapsed that is the same for all observers.
Formally, it’s defined like this:
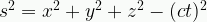
There’s an obvious Pythagorean part with the X, Y, Z squared, and this is, indeed, the distance traveled in space. The kicker is that the time dimension is subtracted from this distance.
Essentially this amounts to the distance traveled minus the time it took.
It’s a bit easier to absorb if we restrict ourselves to the usual two diagram dimensions, X (space) and T (time). Then the formula is just:

And since we consider c=1, and our T-axis is our Y-axis, for our diagrams, it boils down to:

When graphed on a spacetime diagram, we get (hyperbolic) curves that give us a “contour” map of spacetime intervals:
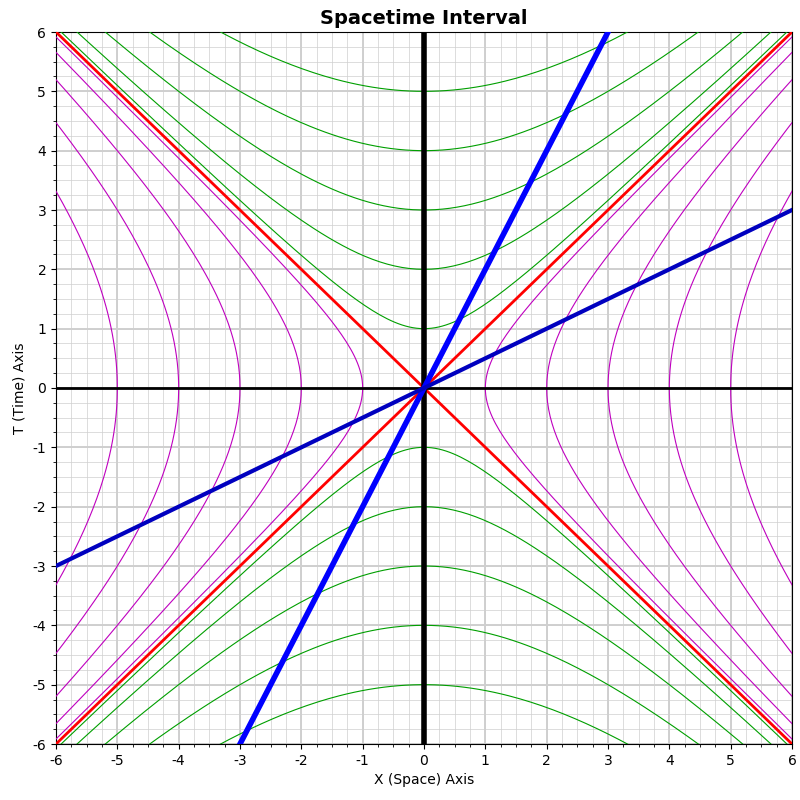
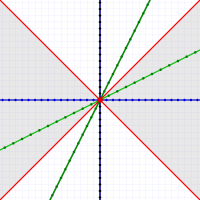
This is the same sort of diagram, except for the curves, that I’ve used in the past. For instance, the diagonal red lines represent light moving towards and away from the origin.
The green lines show “time-like” intervals, and the purple lines show “space-like” intervals. (Time-like essentially means “you can get there from here.” Space-like means you don’t have enough time.)
The lighter blue line is the world line of, let’s say, Em passing Al (the vertical black line) at 0.5c. The darker blue line is Em’s line of simultaneity at the moment she passes Al.
What we most want to notice here is where Em’s blue world line crosses the green spacetime interval contours versus when Al’s vertical black world line does. Both perceive these to be equal intervals!
Also notice where Em’s darker X-axis crosses the purple lines versus where Al’s black horizontal X-axis crosses the same lines. Both Em and Al agree on the length interval represented.
If we viewed this from Em’s perspective, Al would have the longer line (and it would angle to the left), and Em would have the shorter, but both would still agree the interval was the same.
Let’s zoom in and take a closer look at the first time-like contour:
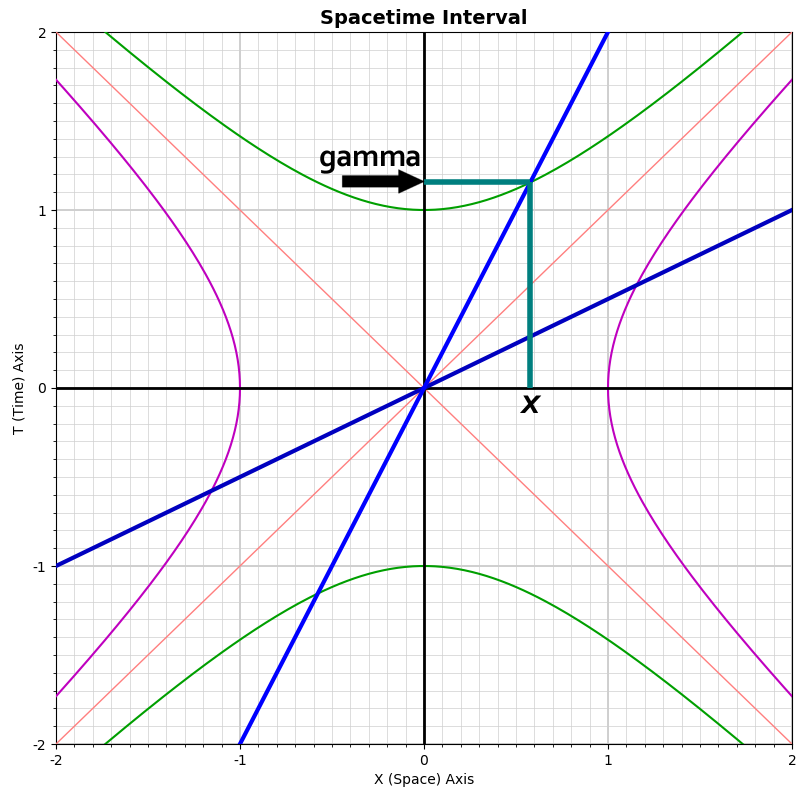
Note the point where Em’s blue world line intersects the green contour line.
Where that point lies on the Y-axis gives us Em’s gamma — the parameter that determines the time dilation and length foreshortening. (Where that point lies on the X-axis is the distance Em has covered in that time.)
§
There is a great deal more to this, see the Wikipedia page if you want to get started on learning more. (Mostly, I just thought the hyperbolae were really pretty and worth showing.)
But a few comments in closing:
Consider standing still for three seconds. Our spacetime interval (in 2D diagram form) is:

Which makes sense. The interval is the distance minus the time, so if we don’t go anywhere, and take time doing it, we’re deducted that time.
On the other hand, if we consider a point in our frame of reference (that is, simultaneous with us), but separated by distance (say three meters), now the interval is:

Which also makes sense. If we could magically instantly transport three meters, our distance minus time would give us a positive number (which we can interpret as the minimum time it would take to get there).
In general, when the spacetime interval is negative, it is called “time-like” which means there is enough time to make the distance. With a negative interval, we can make the trip with time to spare.
If the interval is positive, we call it “space-like.” There is too much distance and not enough time. We “can’t get there from here.”
If the interval is zero, there is exactly enough time assuming we move at the speed of light. Along the light path, the spacetime interval is zero. (Notice in the first diagram above how the contours follow the red light path lines. The light path divides the time-like from the space-like.)
I’ll leave you with what the first time-like interval looks like in 2D:
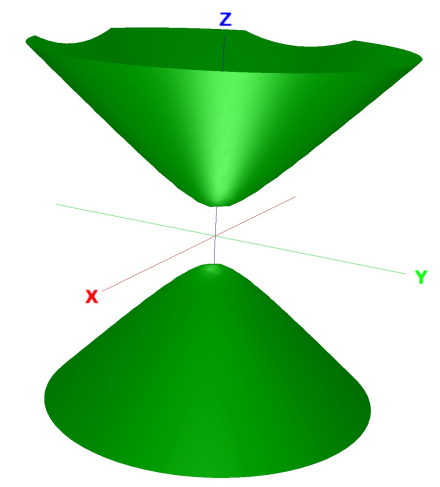
A pretty hyperboloid! The higher intervals would be nested inside.
Stay hyperbolic, my friends!


March 22nd, 2019 at 2:27 pm
One thing I didn’t mention is that the dot markers on the very top diagram, my canonical “Special Relativity image,” are the points where the hyperbolae intersect with a given axis.
Those dots, which I included with most of the diagrams in the series, are the equal spacetime intervals.
August 5th, 2023 at 12:03 pm
[…] recently I wrote about the spacetime interval, and you may recall that distance along the time dimension is subtracted from distance along the […]
February 5th, 2024 at 10:30 am
Thank you for this post. It’s very informative. Just fix the definitions of “spacelike” and “timelike.” You mixed them up.
February 5th, 2024 at 12:32 pm
Ah, so I did. Thanks for mentioning it! I edited the post (and hopefully caught them all).
February 5th, 2024 at 10:34 am
Also if S^2 = -9, S = 3i, not -3 (that’s why we don’t deal with S but woth S^2)
February 5th, 2024 at 12:37 pm
Right, I just didn’t want to get into complex numbers here. As you say, s² is the quantity that matters.
As an aside, sometimes the spacetime interval is defined:
Which accounts for the minus sign on the time axis, but again brings in the complex numbers.
July 3rd, 2024 at 1:38 pm
[…] the math would be “fun” (really!), but anyone would be forgiven for thinking the previous two posts about Special Relativity weren’t all that much “fun.” (I really enjoy […]