 It seems fitting to take this opportunity to write a Sideband post the way I had originally intended when I began them. That intent goes back to the beginning; the first Sideband post was my second post here. For better or worse, the original intent didn’t last long.
In fact, it’s hard to see much difference between the Sideband posts and the other posts. That probably reflects a lack of focus on the main topics. Sidebands were intended for stuff that was off topic. But I’ve been so all over the map on topic that at least one blogger asked if I had a short attention span. [insert here one of the short attention span jokes you’ve heard before]
That’s not going to change. I’m eclectic; so is my blog. Sidebands will evolve. For now, here’s a Sideband on yesterday’s post, just like Blogger originally intended.
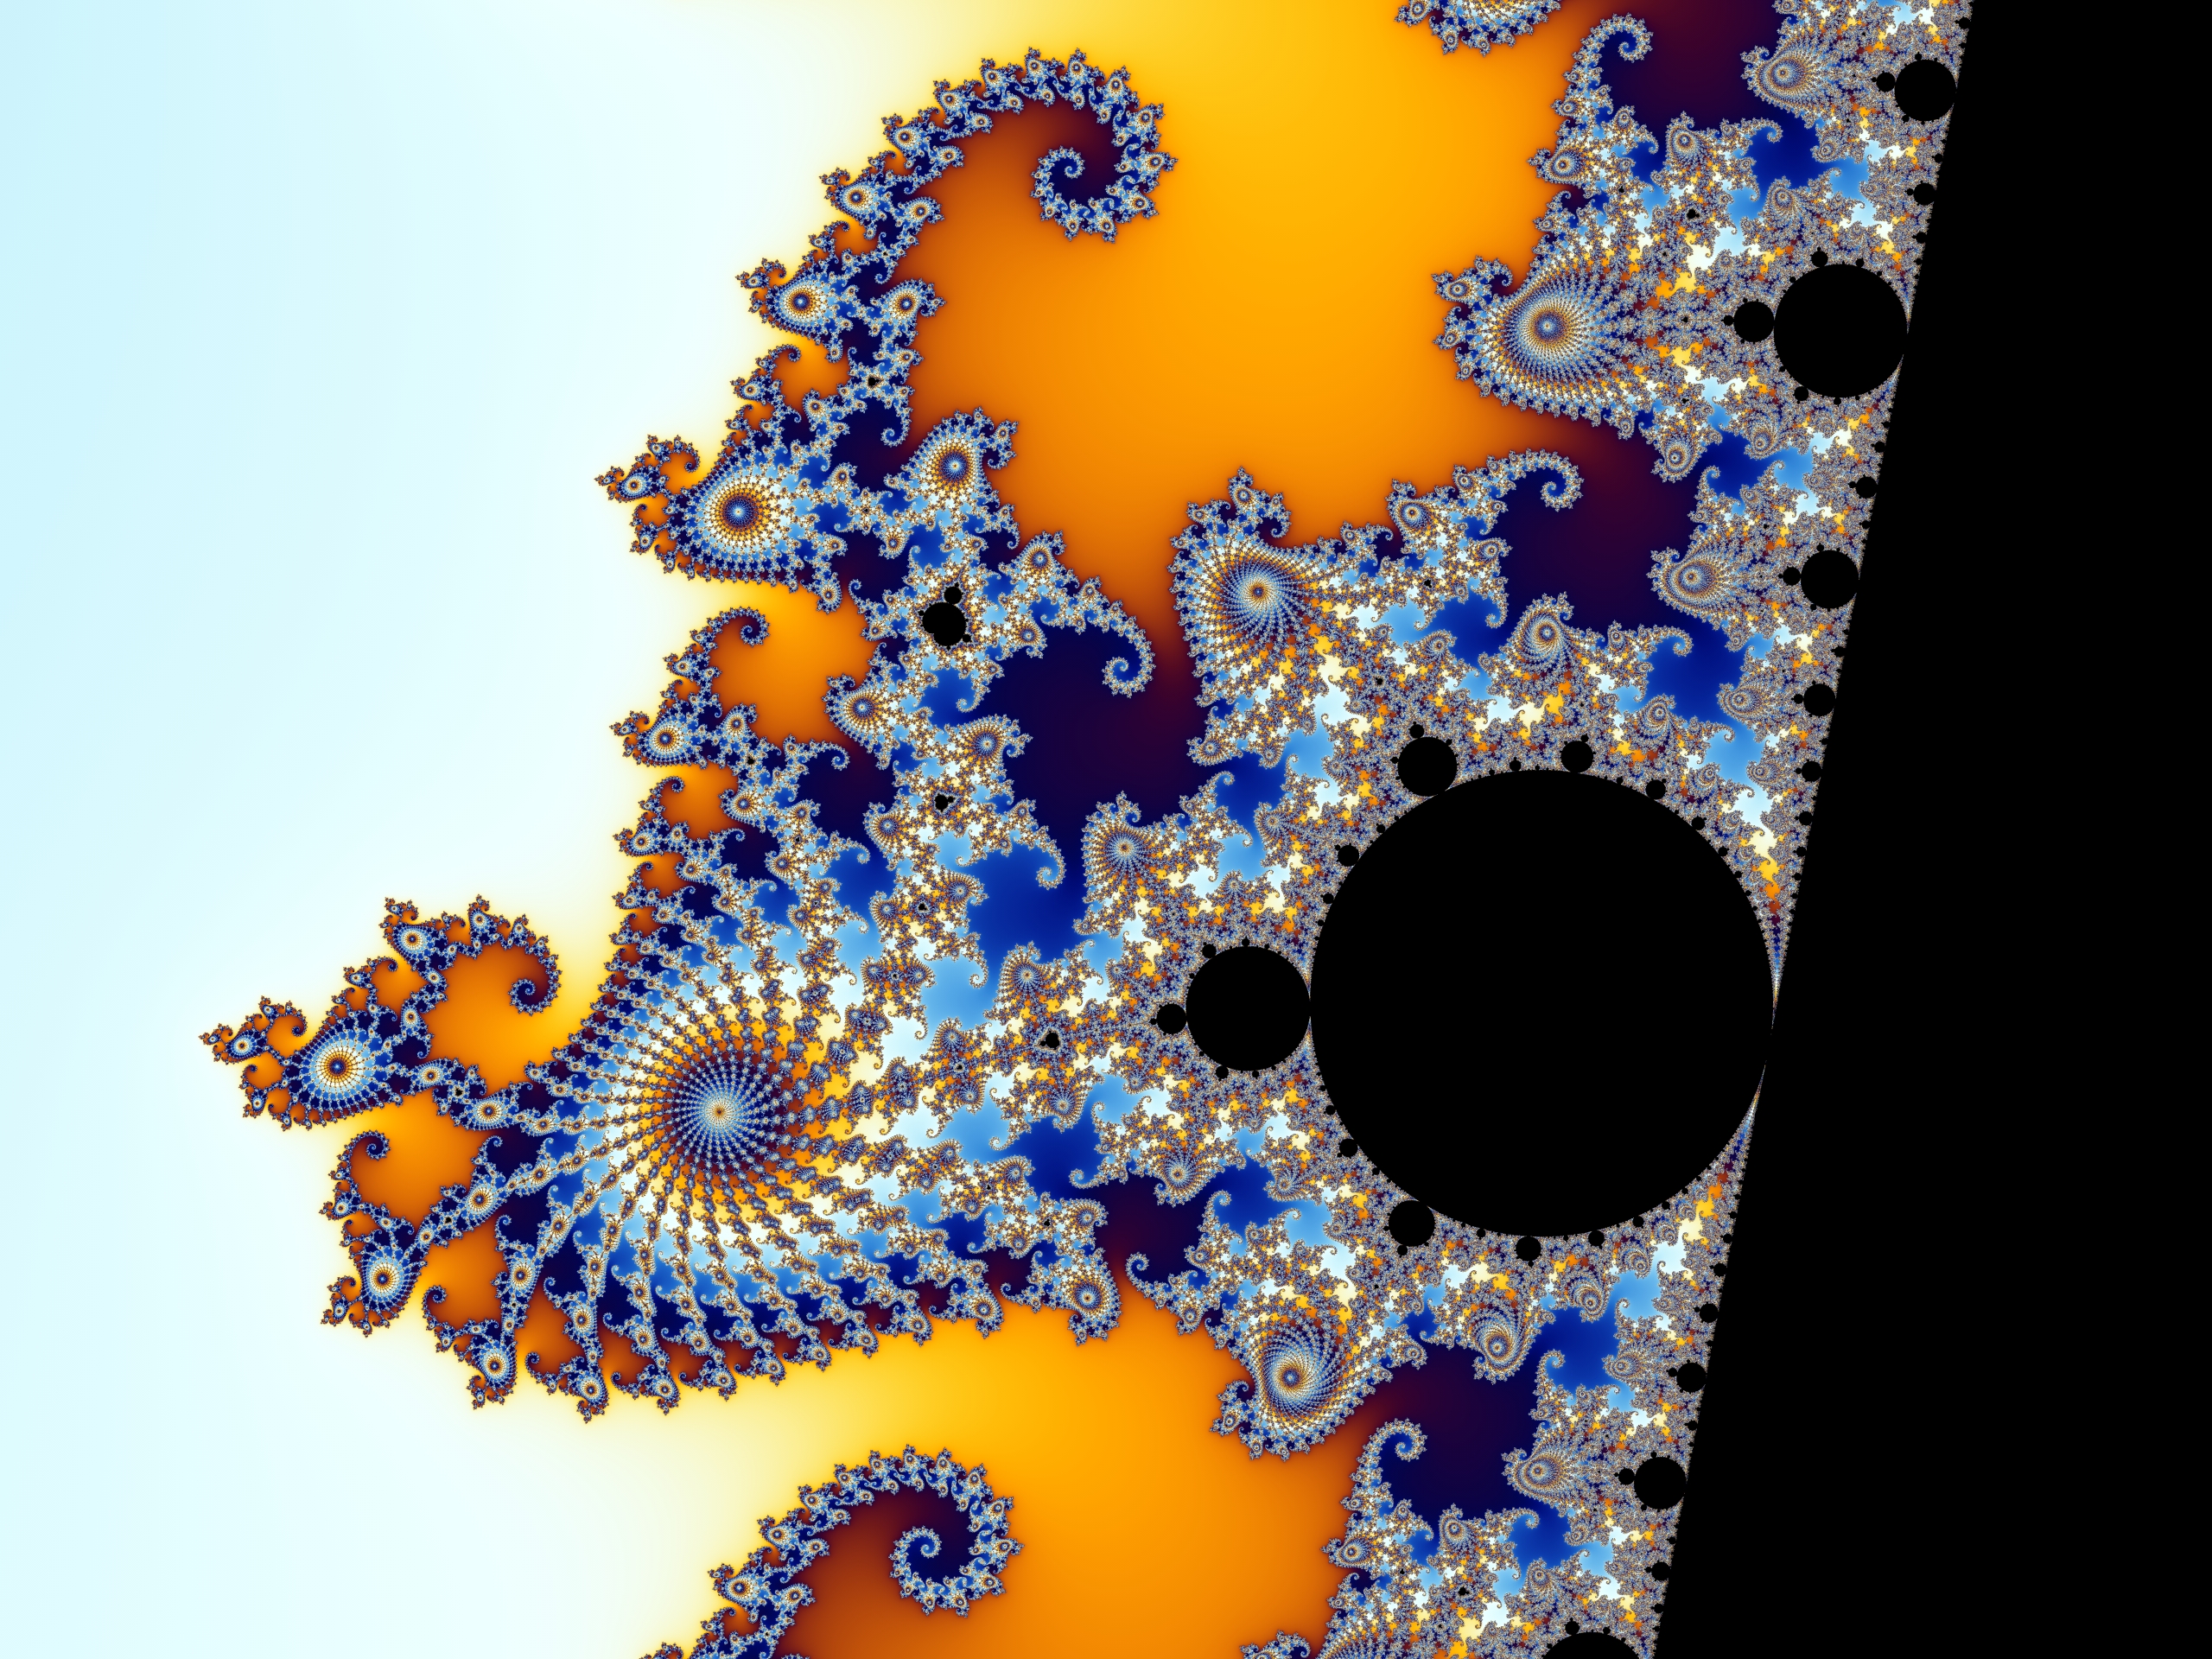
 Yesterday I showed you this small picture of what many of you might have recognized as a fractal.
You may have even recognized which fractal: the famous Mandelbrot Fractal.
I wrote there that, “This is already beautiful. When you understand more about it, it’s even more amazing.”
This Sideband is about those things that make it so amazing as well as why it applies to how the world around us works. If life feels chaotic to you, well, it turns out that chaos (theory) does indeed rule vast parts of our lives.
And the Mandelbrot is glorious, beautiful chaos in action!
First of all, it’s famous because:
 Its namesake, Benoît Mandelbrot, is the inventor of fractal geometry — and the word “fractal” — and a big contributor to the field of chaos mathematics;
- It’s said to be one of the most complex mathematical objects known (I have heard most, but I’ve also heard most claimed for something called the E8 group);
 Despite its mind-bending complexity, the basis of its creation is extremely simple (it is an amazing model of complexity from simplicity);
- It’s stunningly beautiful, especially in the hands of mathematician-artists (or perhaps artist-mathematicians);
- It’s one of the first examples of the incredible power of computer graphics for visualizing complex mathematical objects;
 Its behavior is a visual demonstration of why many real-world processes are impossible to predict in any practical sense.
I want to focus mostly on the last point.
To make sense of the how chaos theory applies here and in the world, I need to explain briefly how the Mandelbrot is created and what makes it both so simple and so complex.
If you already know how the Mandelbrot is generated, bear with me (or — if you prefer — bare with me; that’s right… I’m naked).

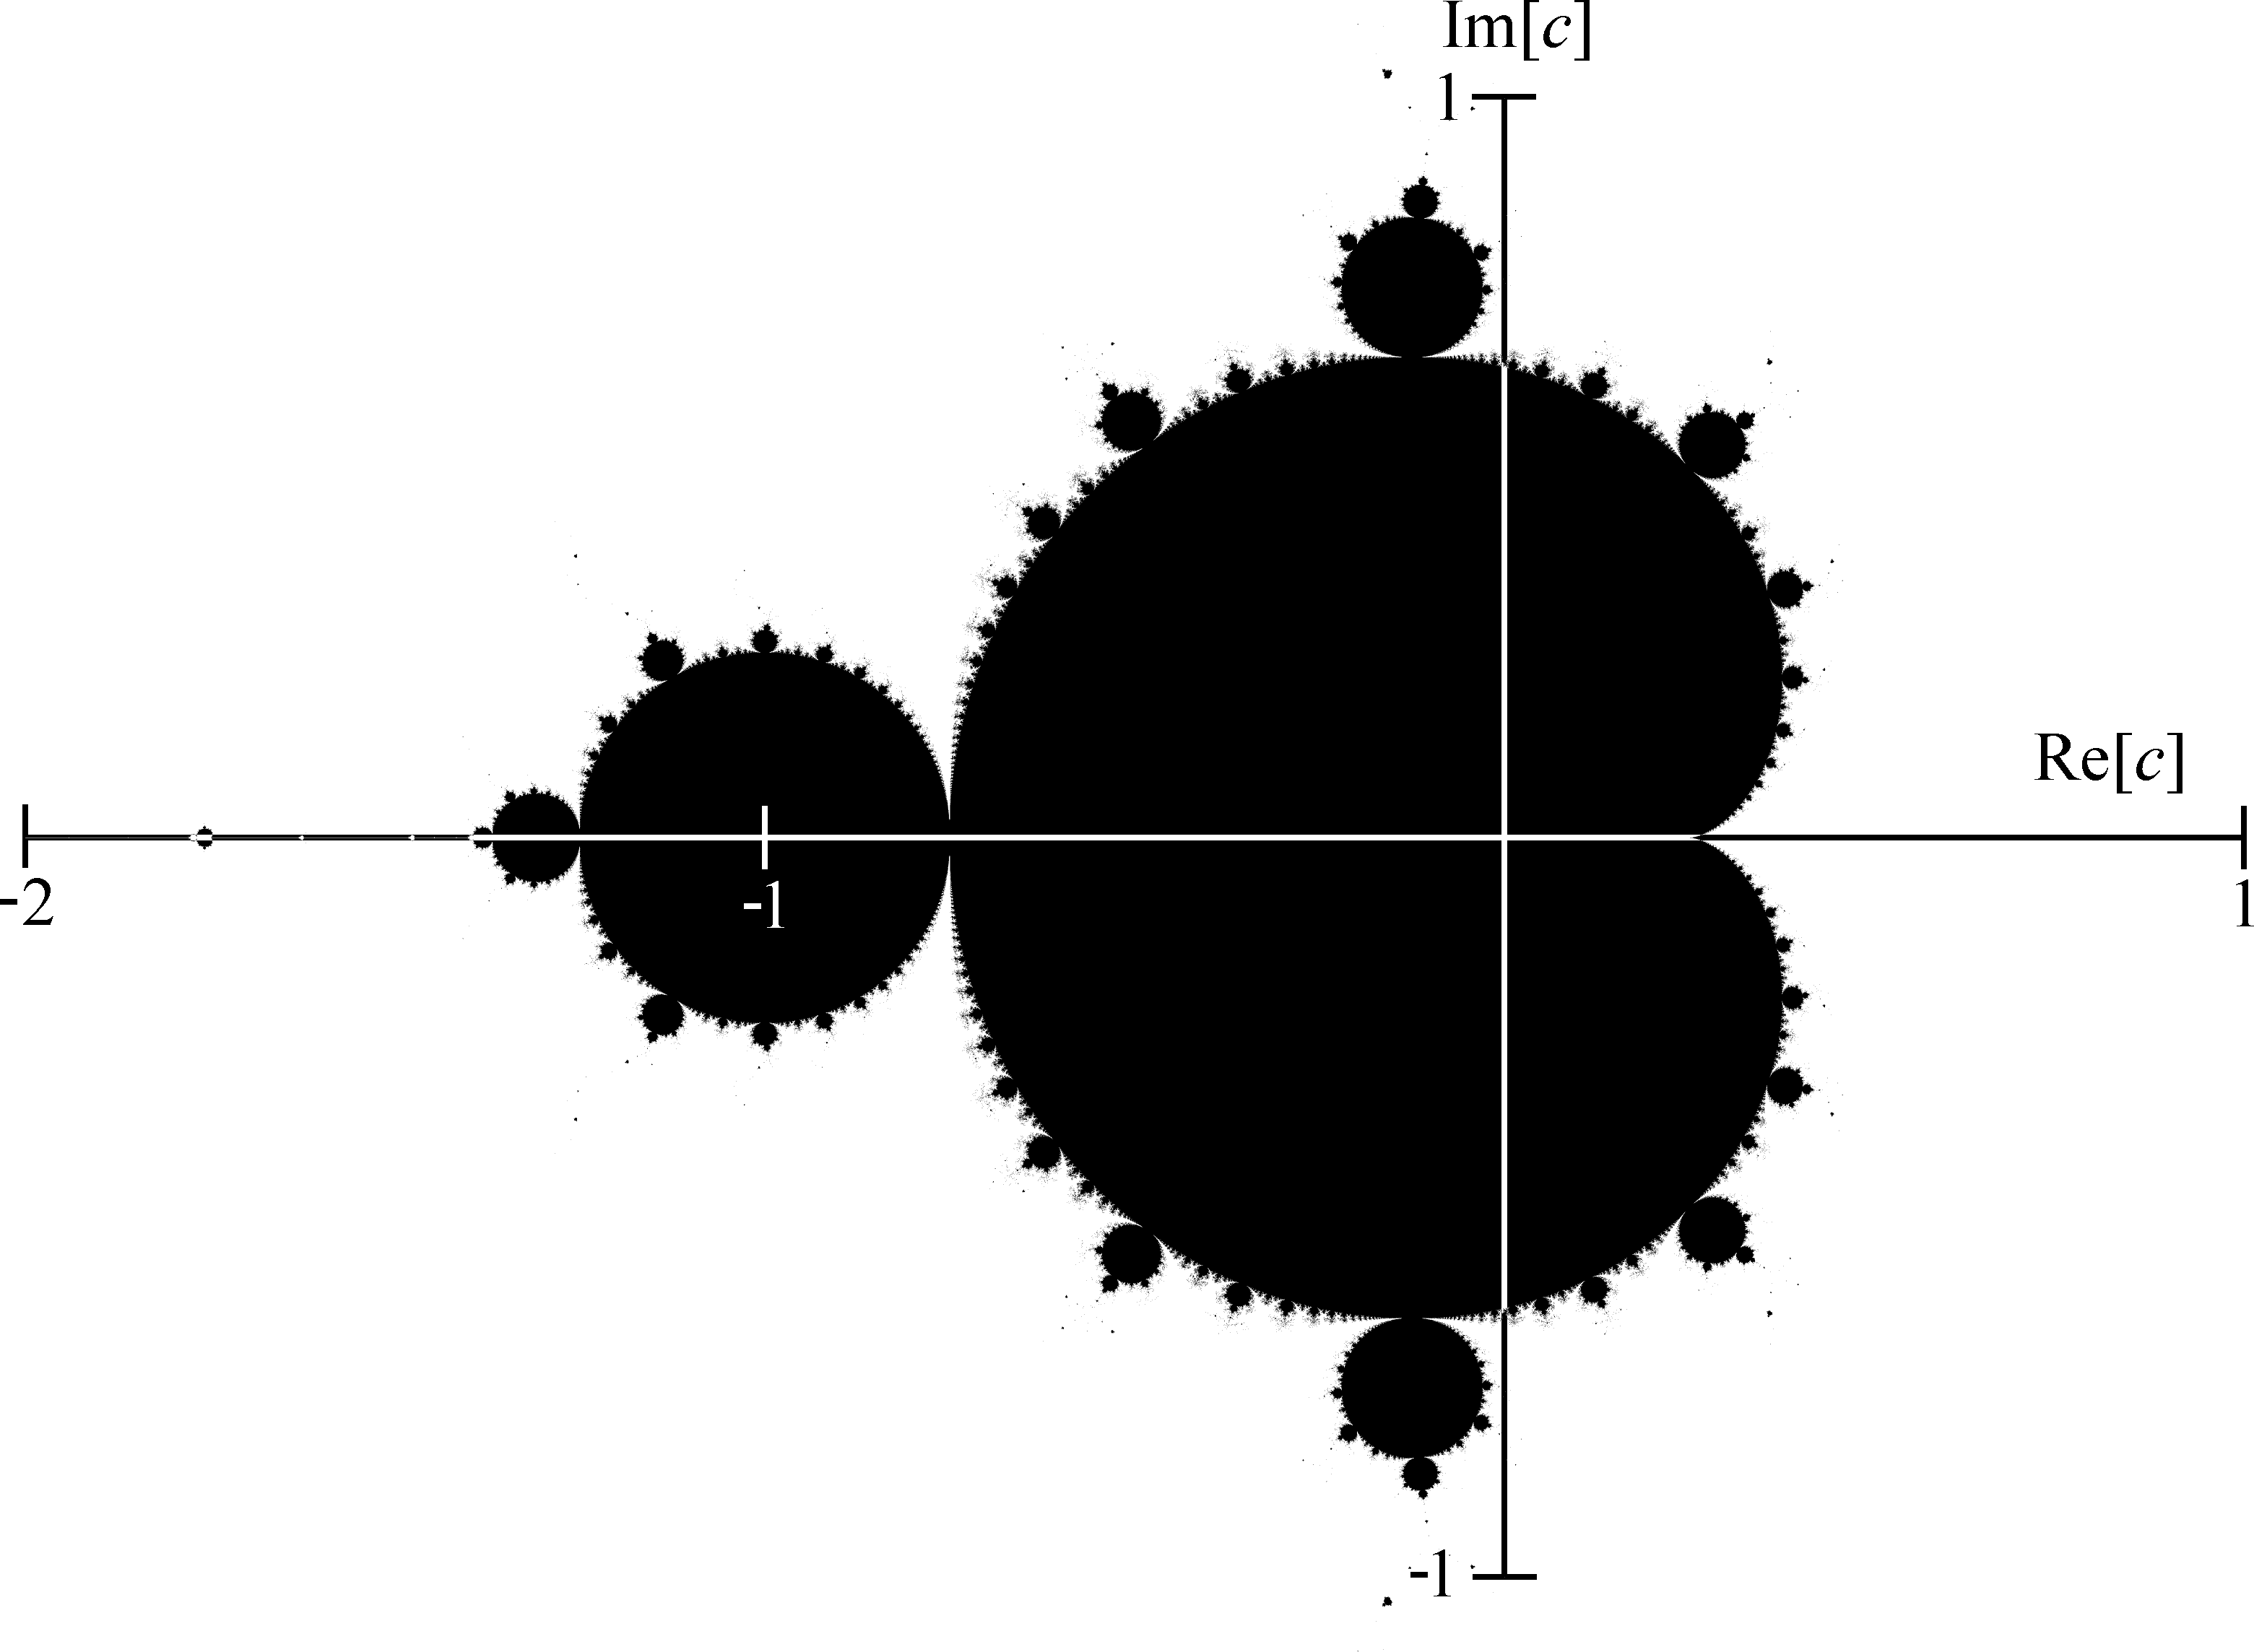
This is the Mandelbrot set!
To generate a hot Mandelbrot plot (on the spot and on the dot (I’ve done this a lot)), we start with a blank canvas.
We’re going to color every point, so it doesn’t matter what color the canvas is.
(I like to imagine it’s a rich canvas-colored canvas, but you could go with a light beige or linen or old eggshell, perhaps. Whatever!)
Now one thing that’s cool is that you could process each point of the painting at the same time.
What we’re going to do at each point has nothing to do with any other point, so if millions of tiny painters could stand on our canvas, one on each point, then each of them could color their spot on the count of 1, 2, 3!
A tiny piece!
Yes, that’s right, rather than angels dancing on the head of a pin, we’re discussing tiny artist-mathematicians painting on a canvas. Same thing.
When we say, “Go!” each painter is going to do a calculation and then color their point based on their result. The color they choose depends on the calculation’s result and the paint palette we give them (16 colors versus millions — how big is their crayon box).
The calculation each painter does looks basically like this:
Zn = Zm2 + C
Now, Z and C are complex numbers, but that’s not important. What’s important is how simple the calculation is.
The only thing that differs from painter to painter is the value of C, which stands for Coordinate. The value of C is the painter’s point “address;” each painter has a different C.
But there is a catch; two catches really.

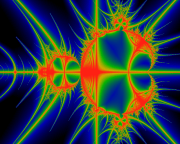
The full M-set again
(different paint scheme).
The first catch is that, actually, the calculation is repeated over and over until one of two things happens: we get tired of calculating or a certain thing happens to the calculation.
For now, I’ll just say the calculation either “escapes” (and we stop immediately) or it doesn’t — in which case we keep on calculating until we get tired.
That brings us to the second catch: some points never escape. The painters on those points are doomed to calculate forever unless they decide to stop.
The points that never escape are, in fact, the Mandelbrot. The closer you get to the Mandelbrot, the longer it takes points to escape (until, at infinity, you’re inside).
Therefore, a key decision in making a Mandelbrot is deciding how long to calculate on points that don’t (seem to) escape.
The tradeoff — and there always is one — is that the longer you calculate, the more detailed your image is. The longer you go, the more long-running points you detect correctly as escaping.

Deep zoom: 17 zeros!
Here’s the final background point: the color selected by the painters is usually based on some aspect of how the calculation escapes.
The art of the Mandelbrot comes from how the painters interpret the calculation’s result.
To do that, the calculation has to end!
In most Mandelbrot images, all the color comes from the points that escaped.
The painters who finally give up just paint their point black (typically, but there are variations).
Here’s the thing: the “Mandelbrot Set” is composed of the points that do not escape.
At the edges of the Set, it takes longer and longer to determine if the point will escape. In fact, it can take millions, billions or trillions of iterations for the point to escape — but if it’s not in the Set it does escape eventually.
Okay, that’s the setup, how does chaos enter into it, and how does it apply to the real world? Now we have the pieces to make that picture.
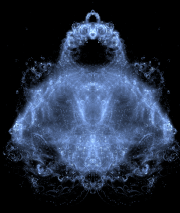
‘BuddhaBrot’ a special way of painting the points.
What makes the Mandelbrot simple is that it’s based on that simple formula repeated over and over against each point on the canvas. The result of the calculation determines the color. Simple.
What makes the Mandelbrot complex is that when you do it, you discover that the simple formula generates an extraordinarily complex pattern.
The inside points never escape, and the distant points all escape quickly. But on the boundaries the system is unpredictable and explodes with complex regular patterns that are self-similar (but never identical).
It turns out that in the boundary zone, even points that are extremely close — even microscopically close — give a different result when calculated. The smallest variation in the input causes a different output result.
And that’s chaos mathematics.

There are neat ways of doing the Mandelbrot in 3D!
Situations where the smallest difference in input — any difference in input — causes a different output are chaotic.
Because of that, they are effectively unpredictable. Even if you could predict them in theory (by knowing all the data), you cannot predict them in practice.
In order to predict, you must calculate.
In order to calculate, you must enter numbers. In order to enter numbers, they have to be manageable — you have to decide how many digits to use. Once you do that, you’re rounding off the original data and you’re introducing differences.
Now your results are meaningless!
The bottom line is that the real world turns out to be filled with chaotic systems (weather, stock market, lots of life processes). It therefore it remains wonderfully unpredictable, literally because of chaos.
The Mandelbrot is a visual representation of that chaos that makes life so unpredictable.
More Technical Depth, You Say?
 I’ve glossed over the details of how the calculation is repeated and what “escapes” means exactly.
Evaluating the right part of the formula generates a result (on the left side of the equals sign), Zn.
This result is then plugged back into the formula on the next repeat as the new Zm.
That creates a new Zn to plug back in as Zm.
Over and over and over.
The C, remember, is the point’s “address” (coordinates), and it remains the same (but different for each point).
The final detail about the repeating loop is that the very first value of Zm is zero. From then on, Zm is always the previous Zn.
There are ways to color the inside, too!
Both C and Z are coordinates (on the complex plane) — they are points on our canvas.
The C point is the one we’re checking out, the one we’re painting at the moment.
The Z point starts out as zero (the “origin”) and jumps around the same general vicinity each calculation.
That is until it starts to jump further and further away eventually heading towards infinity. That’s what we mean by escaping.
If the Z point just jumps around the local neighborhood indefinitely, then the C point in question is inside the Mandelbrot Set.
For all its usual peacock color, the True Mandelbrot set is black and white (not even any gray). Every point on the canvas is either inside or outside the M-set.


December 29th, 2012 at 6:21 am
Reblogged this on wpdhill.
December 29th, 2012 at 10:11 am
And as one of your first posts here! I’m honored!! Have a delicious and Convivial Chillaxmas!
May 31st, 2023 at 11:11 am
[…] seems too much of a topic shift, and I have written about it before, so I don’t really have a good sense of what more to say about it. (I figured I’d think […]
July 2nd, 2024 at 3:39 pm
[…] you are relatively new to this fabulous and fascinating fractal, or need a refresher, please read Sideband #43: Chaos!, or read the linked Wiki […]
July 3rd, 2024 at 1:29 pm
[…] Mandelbrot in March (because math), but I just couldn’t fit it in. I’ve posted about it before; perhaps I will […]