 Today (3/14) is Pi Day. People everywhere (or at least math geeks everywhere) are baking decorated pies (or cakes or cookies) to celebrate. And while this is yet another math-y post, it’s not about pi. I’m more of a tau guy, anyway, so I celebrate Tau Day (6/28), because I get twice the (pizza) pie.
Today is also Albert Einstein’s birthday, which I’ve always thought was a cool coincidence. He’s 145 now (and still being widely misquoted).
But this post isn’t about him either.
What it is about is documenting a simple bit of math I did a while back and which has been residing in one of my many notebooks ever since. But I’ve been trying to eliminate all that paper, and rather than just toss it out, I thought I’d toss it into a (short? we’ll see about that!) post.
Its genesis was wanting to make a better diagram than this one:
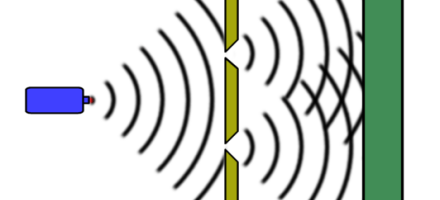
Figure 1. Schematic representation of the double-slit experiment.
Which was intended to illustrate the famous double-slit experiment (where light shining through two small slits in a mask creates an interference pattern on the wall behind it).
When looked at as a wave phenomenon, there’s nothing at all mysterious about the interference pattern. Sound waves and water waves would interfere in exactly the same way. But light is also a particle, a photon, and when the double-slit experiment is looked at that way, it’s not just mysterious, it’s downright weird.
Famous physicist (and bongo player) Richard Feynman is widely believed to have said of the double-slit experiment that:
It has in it the heart of quantum mechanics. In reality, it contains the only mystery.
But I can’t find the source of the quote. It may be from a lecture that was never transcribed. (I did find some references to YouTube videos, so I may try to track it down. Feynman was a wonderful lecturer, so they’d be fun to watch anyway.)
Along the way I did find one of his most famous quotes:
I think I can safely say that nobody understands quantum mechanics.
~The Character of Physical Law (1965), chapter six, “Probability and Uncertainty”.
And this one that really speaks to me (because I, too, am a hard-core realist):
The test of all knowledge is experiment. Experiment is the sole judge of scientific “truth”.
~The Feynman Lectures on Physics (1964), volume I, lecture 1, “Atoms in Motion”.
I just started reading Mind, Language and Society: Philosophy in the Real World (1998), by the (somewhat socially controversial) John Searle, another hard-core realist. I’m loving it, because he nicely debunks the rejection of causality by David Hume (1711-1776) as well as the rejection of matter by George Berkeley (1685-1753). With all respect to my philosopher friends, I’ve long thought both those old philosophers were just dead wrong.
§
But I digress. The thing about the double-slit experiment is that it has been done with objects we think mostly of as “particles” (a term that I think does a disservice to quantum physics — there are no “particles”, just point-like interactions between waves).
Famously, the experiment was done with electrons (by Davisson & Germer as well as independently by George Thomson). It has also been done with larger objects, for instance buckyball molecules (which have 60 carbon atoms and are big enough — about 0.7 nanometers — to be seen with an electron microscope).
So, Feynman had a good point. If you really understand the consequences of the double-slit experiment, you do run smack into the weirdness of quantum mechanics.
Which is all still a digression, but at least it sets the stage. The diagram above is not bad as a schematic representation, but it lacks a certain je ne sais quoi. I used it back in 2020 when I wrote the Wave-Function Collapse post.
[It took me forever to find that post. My WordPress media page (correctly!) told me it was uploaded for the Wave-Function Collapse post, but I misread it as the Wavefunction Collapse post from 2022, which doesn’t get into the double-slit experiment at all. Very confused was I!]
Even back then I wanted something that looked more like this:

Figure 2. Actual depiction of the double-slit experiment.
Which far better illustrates what’s going on but wasn’t something I could whip up in my image and graphics editor (PaintShop Pro, version 7 — an old but still very useful friend from the last century).
No, it required some (simple) math implemented in software capable of generating an image. So, Python (wonderful programming language) and Pillow (capable image generation) to the rescue.
And some basic trigonometry — the math so many hated in high school and were convinced they’d never use.
Basic trig is actually pretty simple [see Trig Is Easy!], but it’s usually taught abominably. Math in general is often taught very poorly, which is why so many fear and hate it. If it were taught better, I suspect more people would be excited about it (because it’s filled with wonderous things).
§
Which brings us to the math-y part (and, fine, you can stop reading now… assuming you even got this far).
We treat the light as an electromagnetic wave, specifically, a sine wave (which is where the trigonometry comes in):
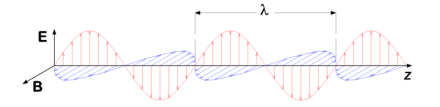
Figure 3. Electromagnetic light wave with wavelength λ and moving in the Z direction. The E axis is the electric field, and the B axis is the magnetic field. For our purposes, we’ll only bother with the E field.
The basic task is to determine the intensity (height) of the wave as it travels along a straight line. In Figure 2, to the left of the mask (white vertical line on the left side), a beam of light is coming from some out-of-sight source far to the left. That beam is mostly blocked by the mask except for two slits that allow the light to pass through.
From the slits the light spreads out (as light often does) and eventually hits the screen on the right edge of the image. What’s important here is that the two beams of light interfere with each other (which is just a fancy way to say they combine).
Light always travels in a straight line, so the intensity of the wave for any given pixel of the image is just a matter of figuring where that pixel is in the sine wave. The formula is pretty simple:

Where I is the intensity (or height) of the wave. Note that the height can be positive or negative as the wave oscillates up and down. The sin (sine) function gives us the y (height) value for any given x along the horizontal axis. The simplest expression of that is:

Here we calculate x as the product of the frequency of the light times the distance from some starting point. The frequency is important because it tells us how rapidly the wave goes up and down in a given span of distance.
But we’re not calculating the sine wave along a (single) horizontal axis. We need to figure out the intensity for any pixel, and those pixels are everywhere in the two-dimensional space. That means we need to work with a diagonal line from the source to the pixel.
§
Enter good old Pythagoras and his famous theorem (which I referenced recently in The Irrational Square). In English, the square of the hypotenuse of a right triangle is the sum of the squares of the other two sides.
In our case, the hypotenuse is the diagonal line from the light source to the pixel in question. The sides of the right triangle are the horizontal distance from the light source and the vertical distance above or below it.

Figure 4. Two light paths.
Here, I’ll focus on doing that to the right of the two-slit mask, but the same idea obtains on the left. It’s just simpler there because there’s only one light source. With two light sources, we must calculate the intensity from both and add them together.
Since the wave can be positive or negative (or zero or anywhere in between), the sum of two waves can reenforce or cancel each other (or anywhere in between).
Figure 4 illustrates how we approach this. On the left are the two slits in the mask, labeled S1 and S2. We want to know the intensity at some point to the right. I’ve shown the light paths for two such points, labeled P1 and P2.
In fact, we need to calculate the intensity for every pixel along that vertical axis, and we need to do it for every vertical column of pixels in the final image.
The distance from the slits to a given vertical column is L, which give us one of the legs of the triangle. L is the same for both light sources. The other leg is the distance above or below a given slit (not labeled in the diagram, but we’ll call them y1 and y2). The hypotenuses (d1 and d2) are the actual distances from the light source to the pixel.
Put it all together, and we have:

Easy peasy, lemon squeezy! The f parameter is the frequency of the light wave. The square roots are because, while the Pythagorean theorem is:

We want the hypotenuse, not its square, so, taking the square root of both sides:

Which, by the way is how we’d calculate the intensity from a single light source:

Where x is the horizontal distance from the light source and y is the vertical distance (and f is the frequency).
§
The only other wrinkle is that the light coming from the slits drops off as the angle increases, so my code also calculates the angle of the line from the slit to the pixel. There’s a term in the final determination of intensity that looks roughly like this:

Where x and y are the horizontal and vertical distances. The arctan function gives the angle, and the cos (cosine) function turns that into a value from 1.0 (when the angle is straight ahead from the slit) to 0.0 (when the angle is 90° from the slit). I squared that to make the falloff sharper.
Lastly, there’s also a term that considers the distance from the light sources such that the intensity decreases with distance. I found that the final image looked wrong without that.
§
Once nice consequence of using software to draw the image is that, because the software is parameterized (meaning its variables are all things I can easily change), it’s easy to create different versions of the image. For instance, the frequency can be low:
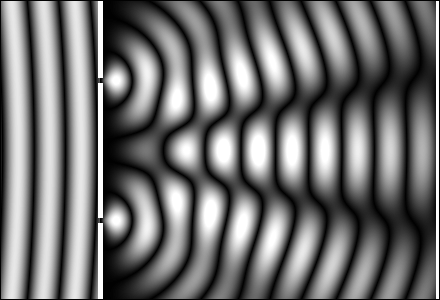
Figure 5. Low frequency light.
Or high:

Figure 6. High frequency light.
And I can move the slits close together:

Figure 7. Slits close together.
Or put them further apart:
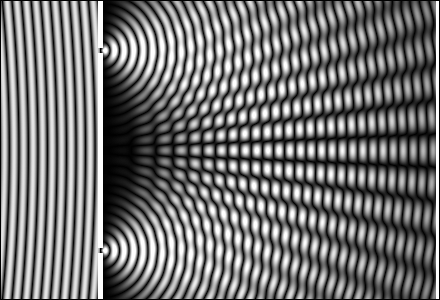
Figure 8. Slits far apart.
And, obviously, I can mix and match those. Which let me create an animated series showing the effect of changing the distance or frequency in action. I made those images into animated GIF (“jiff” damnit, not “giff”) files. I find webpages with animated GIFs distracting and annoying (plus, big ones take time to load), so if you’re curious:
- Frequency animation (3 megabytes)
- Slit separation animation (2 megabytes)
§ §
Now I can toss that page from my notebook — one less piece of paper!
More to the point of this post, despite the adage that “I’ll never use trig in real life!”, I’ve found myself using it a lot in my hobbies and even at work. It’s certainly helpful if you ever want to know exactly how tall your flagpole or tree is.
Stay trigonometric, my friends! Go forth and spread beauty and light.
∇


March 14th, 2024 at 12:21 pm
“We will control the horizontal. We will control the vertical.”
March 14th, 2024 at 12:25 pm
This post really illustrates the whole problem with the Brain Bubbles series. It was meant for short posts, brief ideas, and while I sometimes manage to hit that target, mostly… I don’t. There’s no reason this couldn’t have been a “plain old” post, and it would have been more appropriate as a Sidebands post, but that lightbulb didn’t go on until after I posted it.
Ah, well, so it goes. I’m considering just retiring this series but kind of want to run out the counter, so I’m thinking of calling it quits after either #99 or #100. Thereafter, I’ll try to have any more I post stick more to the original intent. But more likely I’ll just call it quits and do short posts if the mood strikes me.
(I think on some level I view really short posts the same way I do small candy bars. Not much bang for the buck.)
March 14th, 2024 at 12:34 pm
March 14th, 2024 at 1:09 pm
Trig is also handy if you want to figure out how fast the surface of the Earth is moving at a given latitude. All you need to know is the Earth’s radius at the equator, which is 3,959 miles (6,371 km).
Calculating the speed at the equator is very simple: just divide the circumference (2π×radius) by 24 hours:
(Or 1,672 km/hour.)
But if you want to determine the speed at any other latitude, you need trig. (Note that, at the poles, the speed is zero!) Latitude is an angle relative to the center of the Earth, and the cosine of that angle gives you the radius of the circle of latitude at that angle. So, the above becomes:
At my latitude of 45° (north, but that doesn’t matter), we have:
(Or 1,180 km/hour.)
March 14th, 2024 at 6:59 pm
I was wont to use at least the speed of rotation when working out the concepts and impossibilities of a space elevator.
If you consider just 500 miles above the surface the velocity is only: 1167 mph
But, low earth orbit is more like 17,000 mph. How does one make up the difference when “jumping off the lift 500 miles up”?
Step out the doors of the elevator and you’ll fall straight back down. It’s this fact that few folks who think about such a contrivance even consider.
March 14th, 2024 at 7:19 pm
I never worked that out, but you’re right. It’s only 12% or so more than the surface speed. Spaceships arriving would need to slow and match the velocity while spaceships leaving would need to accelerate from the dock. I suppose the advantage is not having to deal with reentry or moving through the atmosphere.
True, “straight down” with respect to the elevator. Speaking of which, there’s a pretty funny What If? about what a pole from the Moon down to (almost) the surface of the Earth would be like.
But I think we can agree that, unless humanity grows up a lot, a space elevator is never going to be one of our problems.
March 14th, 2024 at 8:57 pm
Cool link. I think I calculated that riding the space elevator @ 100mph would take 9 weeks to get to the geostationary end. And of course it’s not really the end as the counter weight would have to extend well beyond there.
March 15th, 2024 at 9:00 am
I bet you’re misremembering the units:
😃
100 mph is pretty slow. Passenger jets go about 500 mph. Surely a space elevator could go at least that fast and even faster once out of the atmosphere. (If travel was inside an airless tube, even the atmosphere wouldn’t slow it down, and it could potentially go much faster!)
If the elevator could go 1000 mph, travel time would be under a day (albeit not by much). That said, a 22,200-mile-high elevator would be one hell of an engineering feat!
March 14th, 2024 at 2:08 pm
Einstein would not have recognized his birthday as pi since in Germany it would haven been written as 14.03.79. Unless, of course, God plays dice with birthdays. 🙂
March 14th, 2024 at 2:51 pm
Ha, true! 😄 They even write it out as 14 March 1879, which at least puts the terms in a logical order. I learned a long time ago that, as far as sorting names, 2024-03-14 sorts them chronologically, although you have to learn to think backwards.
So, Einstein never actually said, “Happy Birthday to me — and it’s Pi Day!” 🤔