
Complete Chaos!
One of my favorite discoveries in life is the Mandelbrot set. Considering it gives me a strong sense of the numinous. I’ve been enthralled by it ever since Fractint, an MS-DOS program that generated fractals. I’ve posted about it a lot here; today I want to take you into the heart of its chaotic behavior.
The Mandelbrot set has a number of properties that make it such a fascinating study: Firstly, it demonstrates chaos theory. Secondly, it demonstrates how complex patterns can arise from simple beginnings. Thirdly, it reveals a problem concerning real numbers. Fourthly, every pixel is a demonstration of Turing’s Halting Problem. It’s also infinitely complex and incredibly beautiful.
Today we’re going to explore the shore of the Mandelbrot lake.
Not the shoreline — that’s impossible because it can’t be computed (due to the Halting Problem).
But we can look at the nearby shore. Images and zoom animations generally avoid the actual shore because, that close to the lake, the system is extremely chaotic. As you’ll see, it tends to make a rendering look like just random static.
For reference, here’s the entire Mandelbrot:
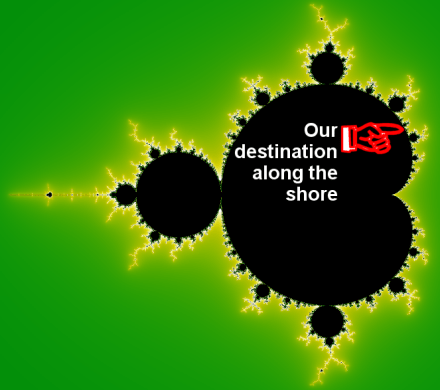
The rendering above shows the entire Mandelbrot set (the Mset), which consists of all the black parts of the image. The flat green parts are well outside the set, and the yellow-white shows the chaos all along the border.
The “lake” is the big black cardioid plus all the circular “bays” along its edge. The bays all have smaller bays on their edges, and the smaller bays have bays, and so on forever.
For example, the large circular bay to the left of the cardioid has a smaller bay to its left, which has an even smaller bay to its left, and so on. I spent some time once zooming in on those left-going bays, and as far as I can tell, they go on forever. (This is another spot that’s close to the lake and computationally intensive to render.)

Zoom (about 950×) of a bay on the lower shore of Elephant Valley. You can see how the valley gets its name. The tendrils create shapes like curled elephant trunks (made of smaller elephants). The elephants even have eyes!
The bays along any edge follow a pattern. It’s most obvious on the main cardioid: There is a single biggest bay (the one directly to the left of the cardioid). Between that biggest bay and the bay’s connection point to the larger lake, in both directions, are two smaller bays (the top and bottom ones on the cardioid).
[The cardioid doesn’t connect to a larger object, so its “connection” is the “butt crack” (known as the “Elephant’s Valley”) on the right. All the circular bays connect either to the main lake or some other bay.]
Between those secondary bays are smaller bays, with smaller bays between them, and so on to smaller and smaller bays (also forever). It’s a lot like the marks on a ruler: 1/2, 1/4, 1/8, and so on.
 There are also tendrils that extend from the bays — one dimensional lines that twist and wind in the border space and extend away from the lake and bays.
All along these tendrils, at all scales of magnification, are “mini-brots” — an infinite number of tiny recreations of the main lake (where everything starts all over again).
Most renderings focus on the tendrils or the mini-brots, because of all that infinite beauty.
I’ve posted a number of examples of that myself, and I have yet to tire of exploring them.
Today I’m focusing on an area next to the lake where the tendrils have become so chaotic as to have no visible structure. It has a beauty of its own, but it’s not the usual Mandelbrot rendering.
§
Numerically, the image above of the whole Mset runs from -2 on the left to about +0.5 on the right (that is, along the horizontal X axis), and from about +1.1 at the top to -1.1 on the bottom (the vertical Y axis).
The entire (infinite) world of the Mset exists well inside a box extending from -2 to +2 left-to-right and top-to-bottom. (This is why a calculation “escapes” if its value ever goes above +2.0 or below -2.0.)

This shows the resulting Mset with an increasing “ceiling” of maximum iterations before giving up and assuming the point is in the set. From top to bottom, left to right, the ceiling is: 4, 5, 6, 7; 8, 9, 10, 12; 16, 24, 32, 64; 100, 1000, 1e4. 1e5. At this scale the general shape is clear with a ceiling of just 100, but the border regions become more and more defined. The renderings below of the shore have a ceiling of 1e7 (ten million).
The Mset is defined as all those X-Y coordinates (pixels) that do not “escape” no matter how long we keep calculating. In a sense, the Mandelbrot is like a black hole — the calculation enters, but never escapes.
Instead, the calculation gives up after iterating some maximum number of times. When this happens, we assume the point is in the Mset (for all we know, if we kept on calculating the point would eventually escape).
As we approach the lake (or a tendril or mini-brot), the calculation runs longer and longer until it finally escapes. The color of a pixel depends on how long the calculation runs. Those color changes indicate how close we are to the border.
[Technical note: Since the range is from escaping after a handful of iterations all the way up to whatever maximum you care to set (tens of millions are necessary for deep zooms) the color palette often repeats itself. The change of color shows the rate of change but doesn’t always indicate a given number. The point is: colors repeat.]
§
Our destination is a point along the upper shore that leads to the “Elephants Valley” (or the “butt crack” of the Mandelbrot):

If we zoom in just a little, we can see how close we are to the border of the lake. We’re headed for a spot dead-center of the red box:

You see how things get very chaotic along the shore.
Just to give you an idea of how chaotic things are, here’s a rendering of the large bay just “south” of the red box in the image above (fairly low zoom level, just over 5000×):
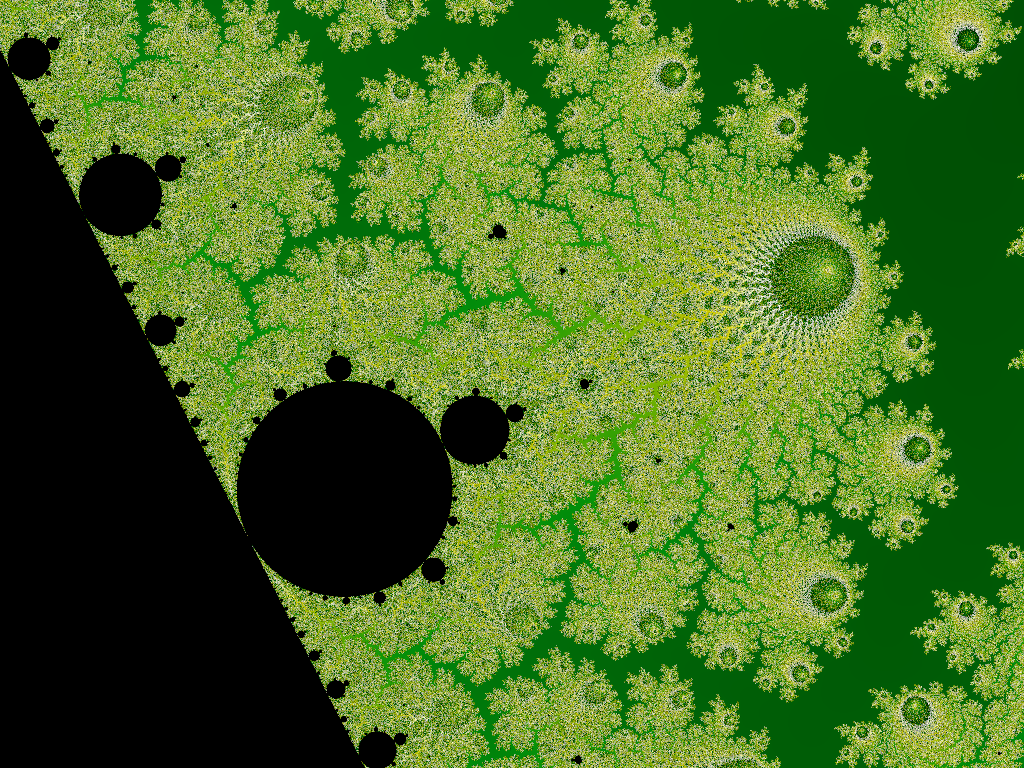
The general neighborhood near the shore. [click for big]
Notice how fuzzy the area around the bays is. This is due to how chaotic the tendrils are in this region. (You can also see a number of mini-brots scattered throughout the fuzz.)
§ §
What all this leads up to is this image:
0.332595… × 0.386893… at a magnification of 5.483e19
The final image (click the above) is 1024×768 pixels, which represents a piece of the Mandelbrot with the dimensions:
wide: 0.000000000000000000072949053766
high: 0.000000000000000000054711790326
It is centered on the coordinates:
X: +0.3325950241172014329690892993
Y: +0.38689394095057407536264564545
Given the pixel resolution combined with the width and height, it turns out that the pixels in the final image are separated by a distance of just:
0.00000000000000000000007123931031
In both the X and Y directions. (That’s 22 zeros after the decimal point!)
§
Note the precision of these numbers — all the digits are important.
Therefore, generating Mandelbrot images requires special math software to handle arbitrarily large numbers. That was what Fractint brought to the table — special routines coded in assembly to do that kind of math.
§
You can click the image at the top for a bigger version, but what’s important is what that green “static” area looks like close up:
![]()
As described above, each pixel is an extremely small distance from its neighbors. The color of the pixel is determined by its location — in fact, that’s the only input to the algorithm that determines how to color the pixel.
This vividly illustrates the impact of a difference of only 7.12-23.
Chaos magnifies that tiny difference into a completely different outcome.
What’s more, the chaos is essentially scale-free. It looks pretty much the same at any zoom level.
§
The image took almost 47 hours to render on my Dell XPS 15 laptop.
The maximum iteration ceiling was 10,000,000. Thousands of pixels in the image went the full ten-million and are thus considered inside the Mset, but would probably escape with a higher ceiling (and many more hours of calculation).
In contrast, that image from the Elephant Valley took only about 10 minutes.
On the other hand, that “general neighborhood of the shore” image took over 5-and-a-half hours. It takes a lot of computation to render any image close to the lake, a tendril, or a mini-brot.
Basically, any time we get close to the Mset, it takes more and more calculation to determine if we’ve crossed the border.
Which, remember, we can never actually find — only that we’re outside or (probably) inside.
Stay awed, my friends!
∇


December 15th, 2019 at 3:26 pm
The white regions in the image are part of the outside that winds its way down into the chaotic twisting of the tendrils. In the neighborhood image, these look a bit like waterways in a swampy river delta.
Those smooth areas have a similar (and relatively low) iteration count before escaping. There is an infinitely complex boundary between these smooth regions and the highly chaotic regions.
Importantly, nothing here is random! It just looks that way. But every rendered image with the same parameters looks identical.
December 15th, 2019 at 3:55 pm
There is apparent circular structure in the large chaotic region (and a little visible in the secondary regions). I suspect this is, in part, an artifact from an interaction between the pixel size and the underlying structure.
In other words, a kind of Moiré pattern. But at the same time, there really is structure there, and it would have circular characteristics.
What’s really there is an “eye” such as found in the elephants image or the neighborhood image. They’re center points with tendrils radiating outwards. Some of them are spirals.
December 15th, 2019 at 6:41 pm
Mind officially blown. Just in time for Christmas. Thanks!
December 15th, 2019 at 6:52 pm
Glad you liked it. Here’s a Christmas zoom from my favorite YouTube Mandelbrot channel:
Watch it full screen, best resolution possible, on your best monitor. 😀
December 16th, 2019 at 5:49 pm
Here’s a very good video about chaos:
May 27th, 2021 at 7:29 am
[…] It’s also thinking about the math behind the animation. As I’ve written about before (more than once), the Mandelbrot is especially mind-blowing in that […]
June 13th, 2024 at 6:11 pm
[…] chaos theory makes it clear those digits matter when we’re doing calculations, which determinism and reductionism […]