 For a bit over a year now, I’ve included various monthly weather charts and observations in the Friday Notes posts. In some cases, those sections were lengthy enough to call for their own posts. (Which would also keep those not caring about my local weather out of said weather.)
Therefore, as of today, a new Weather Notes subdivision of Friday Notes (similar to the Science Notes subdivision established two years ago). Easy now to ignore if so inclined.
And now, the weather…
It seems especially appropriate to begin a Weather Notes series today because our summer seems to have done gone away. And quickly. One moment it was definitely A/C weather but nice enough to hang around outside; the next, I had to turn on the furnace.
Well, okay, not quite that quickly. I spent about a week wearing sweaters and with windows mostly closed to contain the heat (generated by me and the various electronic devices). I really do hate not having open windows, which is why spring and (especially) fall are my favorite seasons.
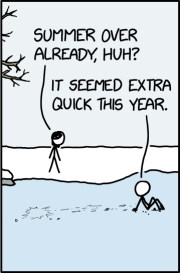 Suffice to say that the recent xkcd comic struck a resonant chord. It seems I’m not the only one who noticed.
Overall though, I’ve had a decent number of open-window days this summer. As they say, it’s not the temperature, it’s the dew point, and those have been reasonably low enough times to make summer very enjoyable.
I expect that it will warm up again (the so-called “Indian Summer”), but summer has clearly begun to pack up for the winter.
A bit weirdly, the leaves haven’t turned yet. I’m guessing here, but it might have to do with having had a fairly dry summer — not as much rain as we usually get during the summer. (In some places in Minnesota, rainfall was well below average. Here in the Twin Cities, we got only 58% of the usual summer rain.)
Which means that the rain we’ve had the last couple of days is welcome!
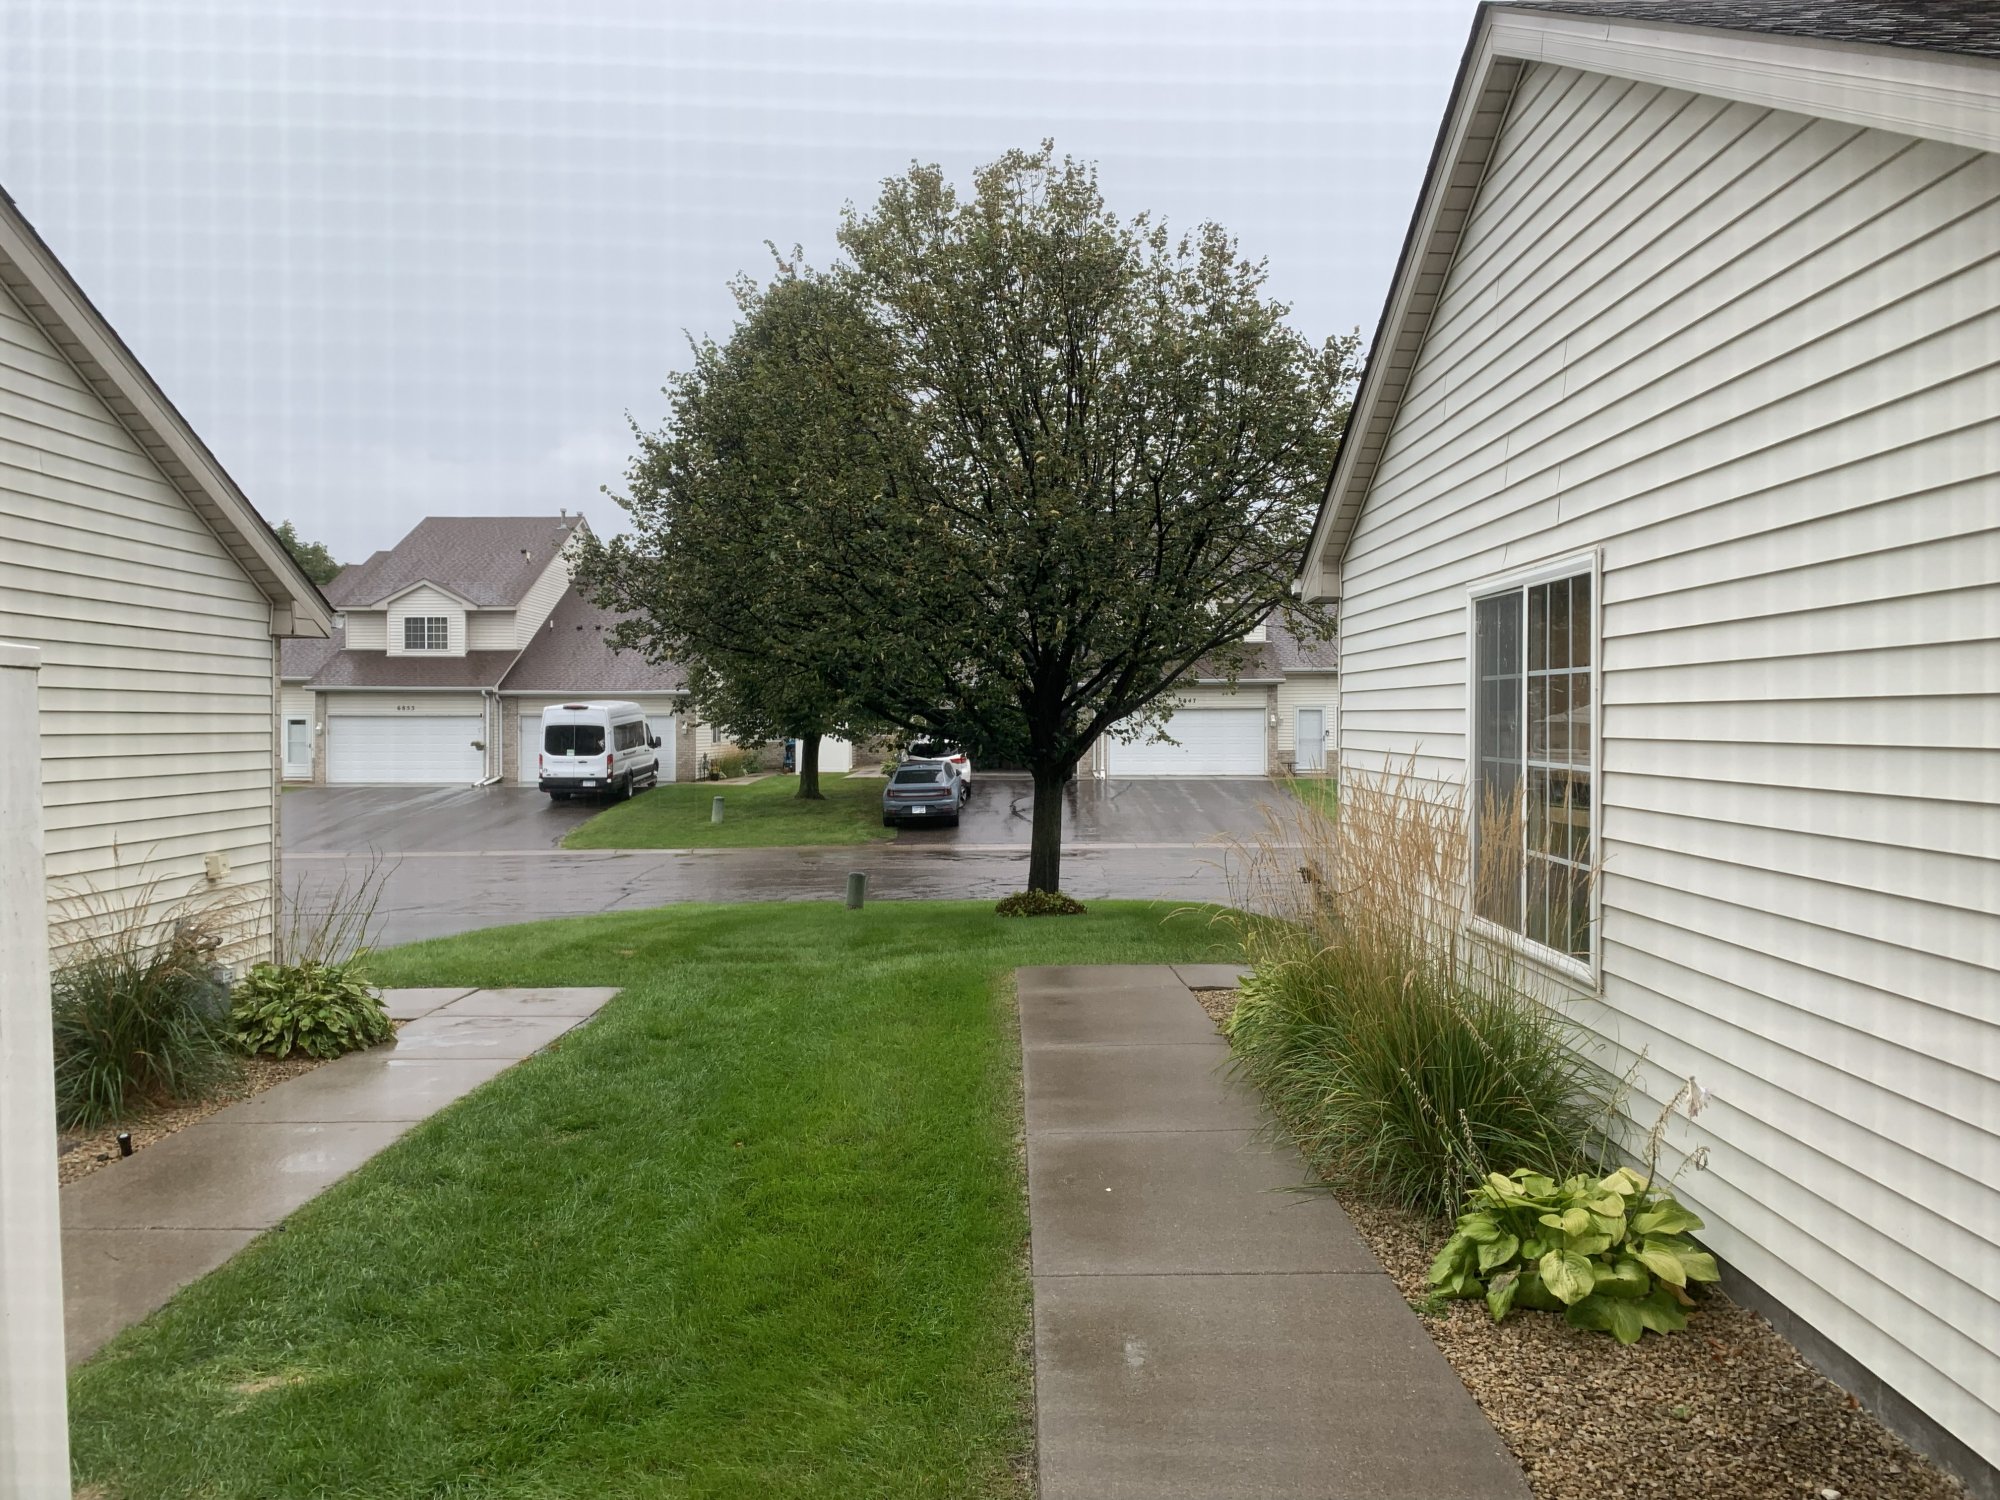
Note the moiré pattern in the photo above (very apparent in the sky). It’s because the new windows in my bedroom and office have screens on both sides rather than on just one as the old windows did. I used to able to shoot that image (which long-time readers have seen a lot) through just glass. Now I’m shooting through the mesh of the screen, and it creates a moiré pattern.
Which, yes, is annoying (but my new windows are not the topic today).
§ §
There were no Notes posts of any kind in August, so I have some catching up to do…
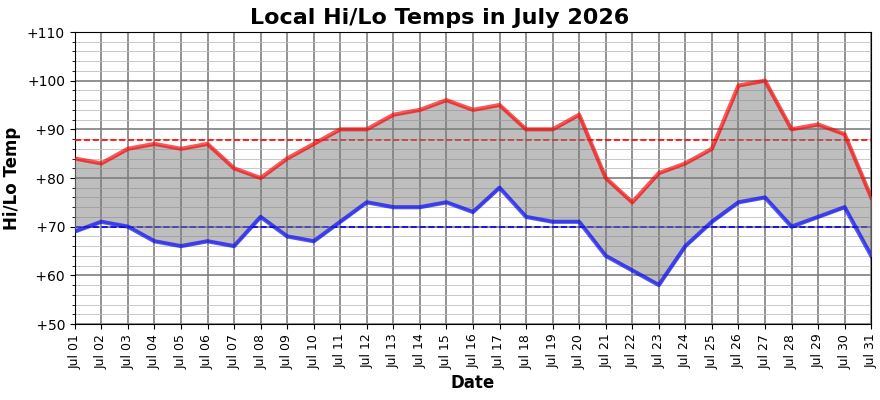
Above are the daily highs (red) and lows (blue), along with the monthly averages (dotted lines). Below is the essentially same chart but with historical traces of past months back to 2013:
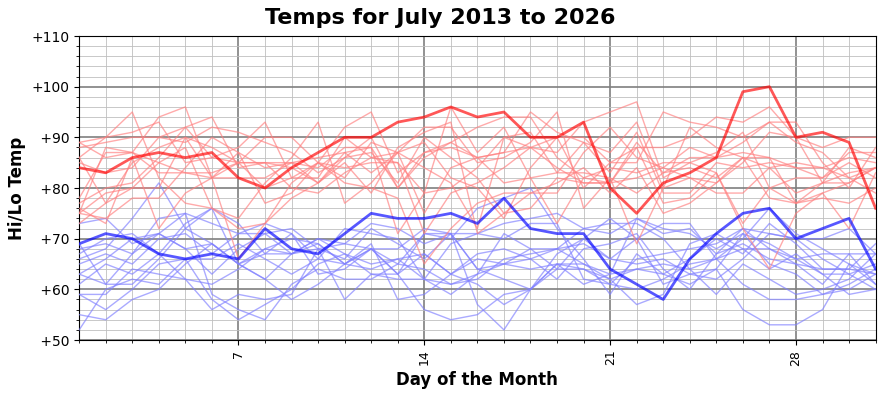
We actually set a record for high and low temperature on the 26th and 27th. Mid-month temps were on the high side compared to the last decade-plus (some record-breakers, there, too). We had a bit of a cool dip on the 22nd, but not a record-breaker (not far off, though).
The lows were generally on the higher side historically, so it was a warm July.
A new chart I’m experimenting with shows the hourly temperature and dew point over the month:
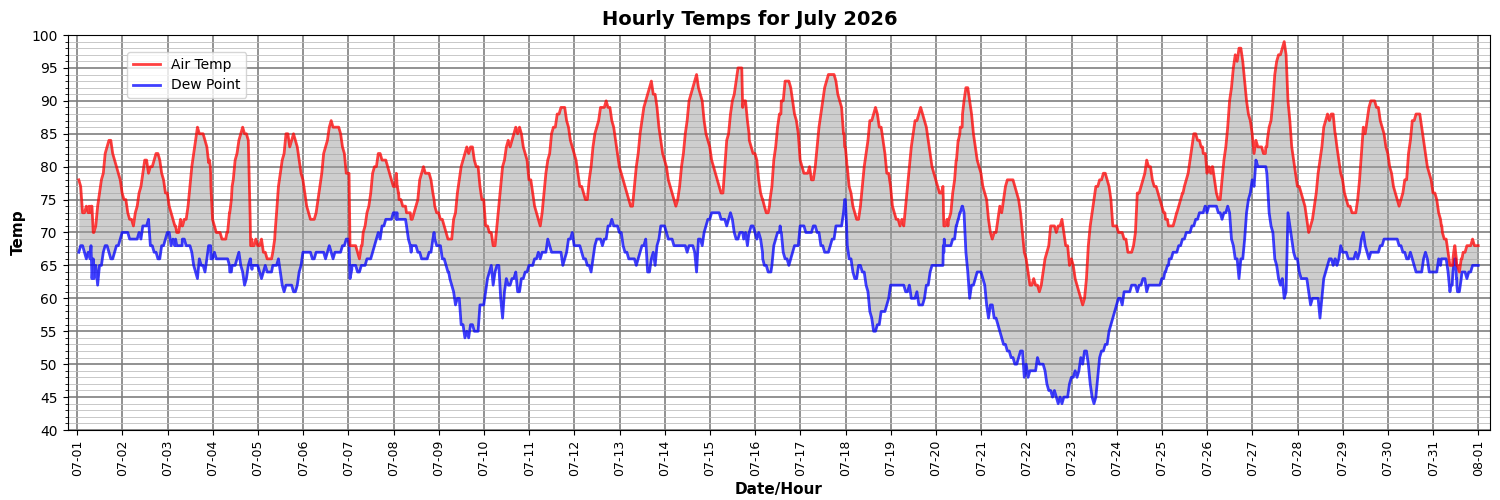
It’s a good way to see how painful the heat felt. The closer to the temperature the dew point is, the muggier it feels. If the temp is low, it feels swamp-like; if the temp is high, though, it feels like a sauna. When it’s bad, it can be a health risk for some.
So, for instance, in the early hours of the 27th, when the overnight low dropped down to only the low 80s (already ugh) and the dew point rose to 80°, that was miserable. Shut the windows and crank up the A/C, for sure!
I like the chart; it has more data than the daily high/low chart and shows the dew point, which is such a key factor in the weather here. Currently, creating the chart is a bit more manual than for most of the other charts. Ideally, I’d like to look into actually pulling data directly from a local weather station, if I can.
§
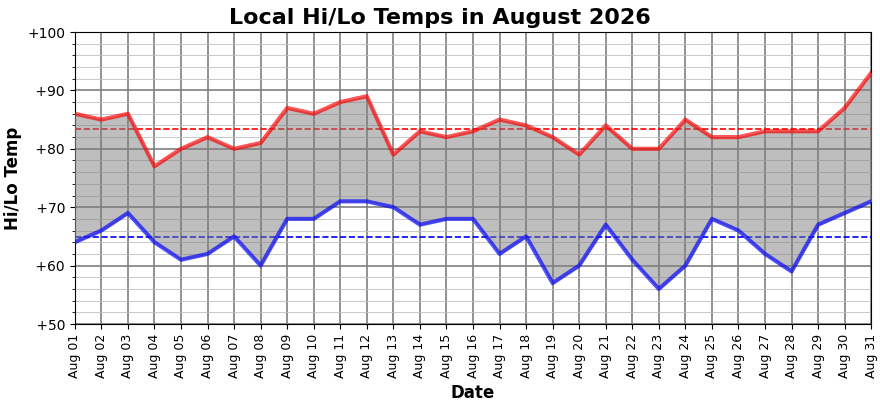
August, with an average high of just under 84°, and an average low of 65°, was fairly mild. Note the scale difference: only up to 100° rather than 110°. Compared to previous years:
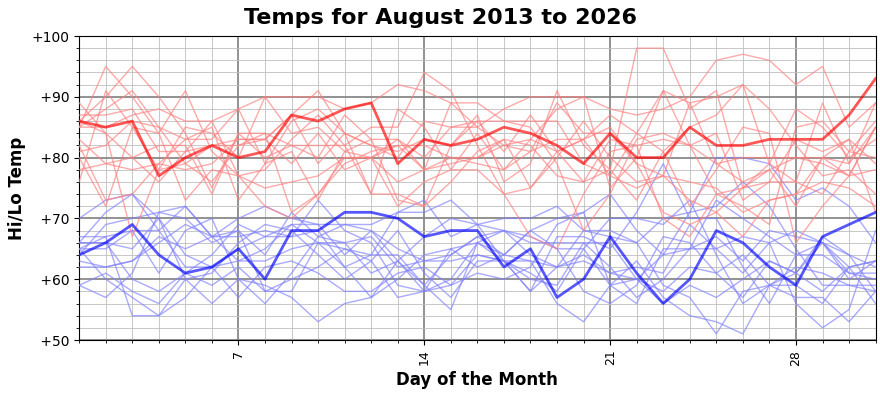
August was about average, overall. Some nice cool days that let me turn off the A/C and open the windows. (Keep in mind that the low temps are generally the overnight lows when I’m cozy in bed under a blanket. So, temps down to the mid-50s are fine.)
The hourly chart for August:
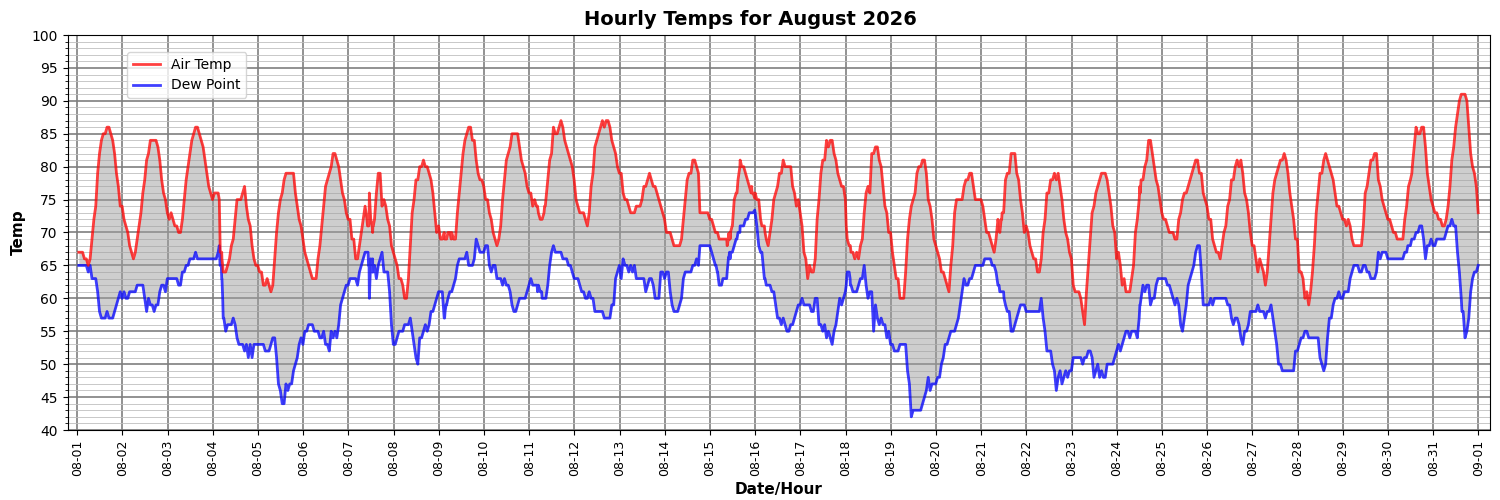
Things got a little sticky a couple of times, but the dew point only rose above 70° a few times (on the 15th and on the last two days of the month). We saw dew points falling to the 50s more often in August than the single time in July.
I was actually a little surprised so many of my neighbors were running their A/C throughout the month (with my new hearing aids, I can hear their compressors running). Many of those days, I was enjoying sitting outside — the weather felt wonderful — and I pitied the poor fools with conditioned air.
§
So far this month:
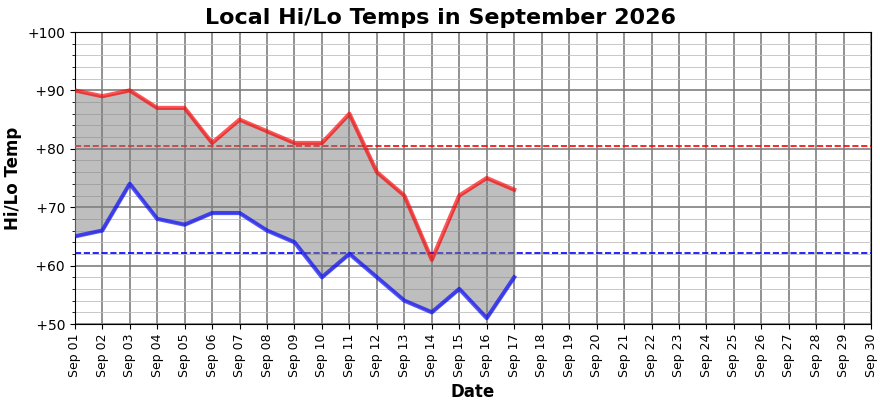
You can see what we mean by a sudden end of summer. The high and low temps have been generally dropping since the month began. With a huge dip on the 14th (a storm system moved in that day, and it has been semi-rainy ever since but especially today). Compared to previous years:
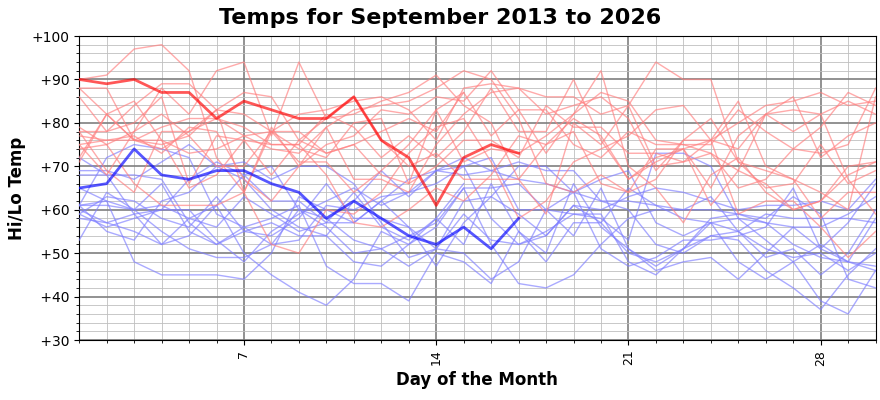
The 14th set a new record for a low high. On the other hand, the low temps haven’t been bad. And we generally see temps dropping in September as we switch from longer days to longer nights (which makes me SAD).
The hourly temps (so far) for September:
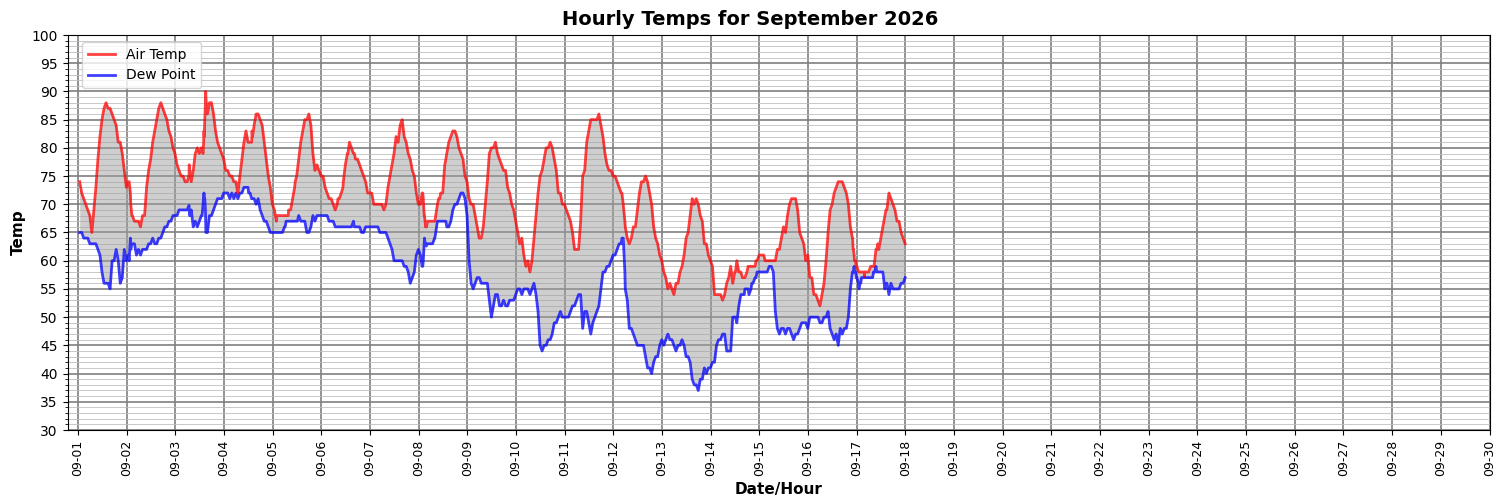
We had some sticky days early in the month, but lately the dew points have been wonderfully low (except for the rain).
§
Back in July, I introduced a chart of temperature departures from historical averages.
Here’s the departure chart for July:
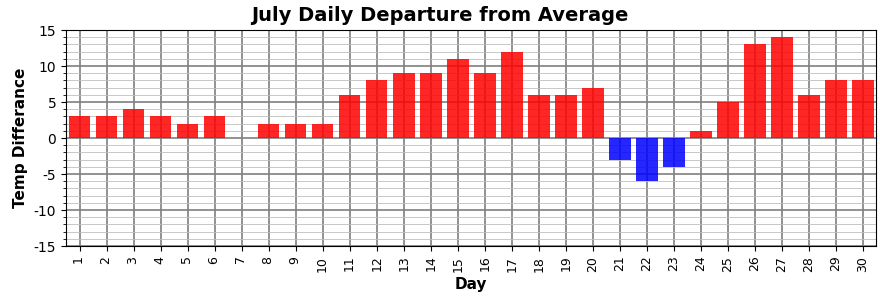
Generally speaking, temperatures were warmer than average. Sometimes by a fair amount.
The August temperature departure chart:
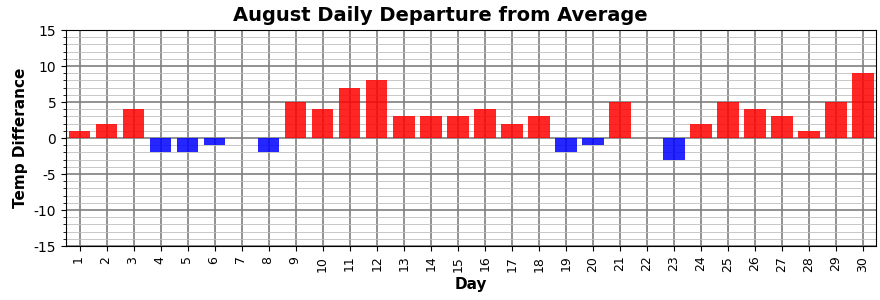
Temps were closer to average and a bit more likely to be below.
And for September (so far):
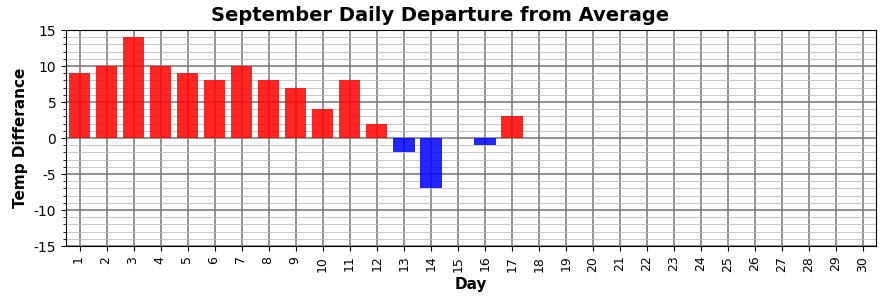
A very warm start to the month with a dip below average on the 13th and 14th (notably below average on the 14th). Yesterday was nice, though.
I rather like these charts, too, and the data to make them is in the daily temp PDF files I copy from the DNR site, but I’ve only been storing the high and low temps. I’d like to capture all the data in the PDF files, but that requires designing a new storage method (it’s too much data for a big JSON file) and then capturing all those months again. (It’s not horrible, just a bit tedious.)
§
Also in those PDF files is data called “heating days” and “cooling days”, which is also temperature departure data, but from a fixed point (65°). I also introduced the HDD (Heating Degree Days) and CDD (Cooling Degree Days) chart in July.
For July:
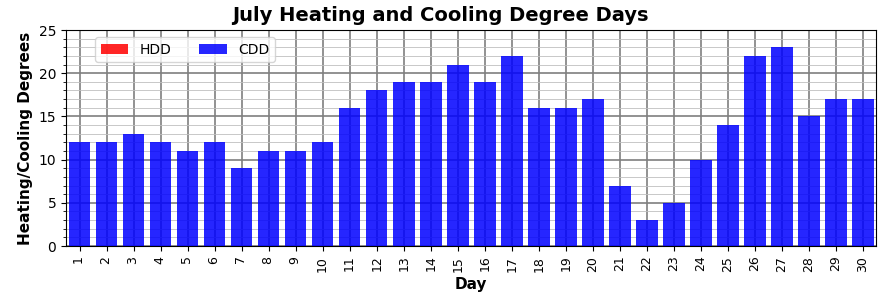
Lots of days with the A/C (assuming you want it cooled down to a chilly 65°).
For August:
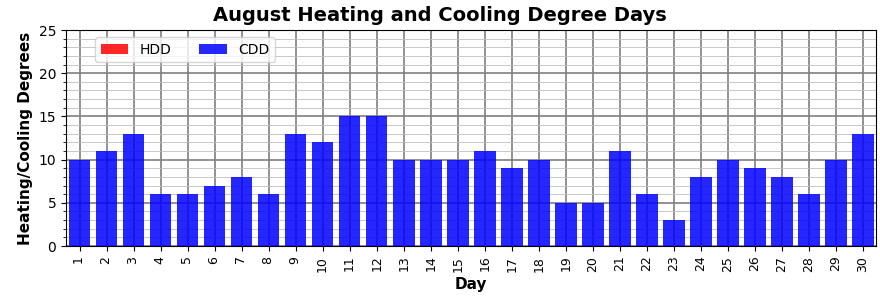
Not as bad as July, but an apparent need for the A/C. (I guess my neighbors are seeking that 65° chill,)
And thus far in September:
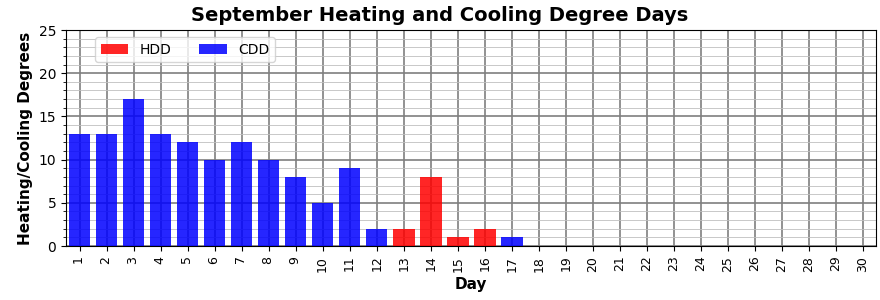
Yep, no surprise there, although I waited until today to turn on the furnace. (Is it just me, or is Sept 14th flipping us off?)
§ §
And that’s the weather.
Stay warm, my friends! Go forth and spread beauty and light.
∇





September 18th, 2026 at 2:19 pm
Nine posts this month! Haven’t done that since September of 2024.
September 18th, 2026 at 4:11 pm
80 today here.
And that was a LOT of charts! Are you all charted out now?
September 18th, 2026 at 6:12 pm
Heh, not at all; I enjoy visualizing data (used to be part of my job).
September 19th, 2026 at 6:48 pm
Still highs in the mid 90s here. Although that is better than highs over 100. We don’t start getting cooler for real until later October.
September 20th, 2026 at 9:02 am
The wind has been out of the north, so we’ll have a week of highs in the low 60s. It was 57 when I walked Bentley this morning. Good sleeping weather!