 I’m starting the draft of this Weather Notes post for this coming Friday on Wednesday mid-morning, the day after the mid-term election. That political weather report revealed the shift that has (at long last) occurred in US politics.
It is much as if the raging storm we were forced to try to find refuge from has finally lost its iron grip. The bluster, darkness, and danger continues, but just maybe an end is in sight.
But that’s all I’ll say about that for now. This post is about the actual weather here in Minnesota this past October.
Depending on conditions, it can arise as early as September, but it’s usually in October that I start having my Three Winter Questions in mind:
- Will it snow by Halloween? (Bad, potentially awful.)
- Will it snow by Thanksgiving? (Desirable; not required.)
- Will it snow by Christmas? (It had damn well better.)
Each year the answers to those questions differ, not just in their factual result, but in the implications for the season.
On the occasions the first one is yes, it can mean a long winter:
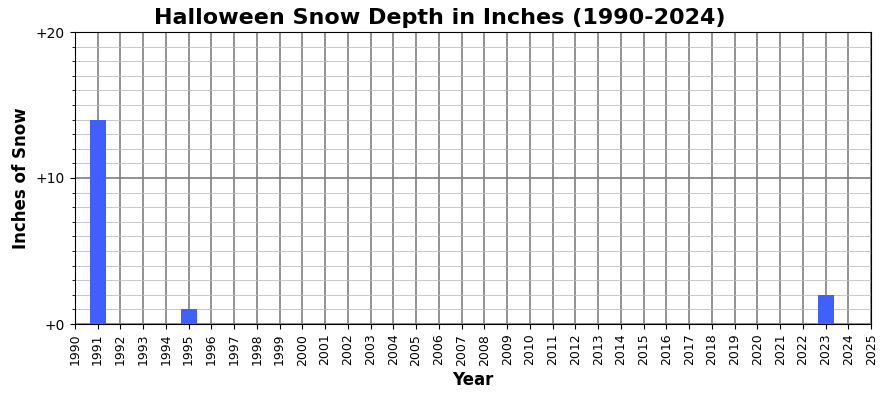
The chart above includes snow from October 31 and November 1. It’s bit deceptive in two ways. Firstly, the chart for just October 31 would have only the two inches in 2023, nothing else. Including November 1 reveals the snowfall from 1991 and 1995. Secondly, that 14 inches in 1991 was just the beginning of the 1991 Halloween blizzard.
When the chart includes October 31 through November 6:
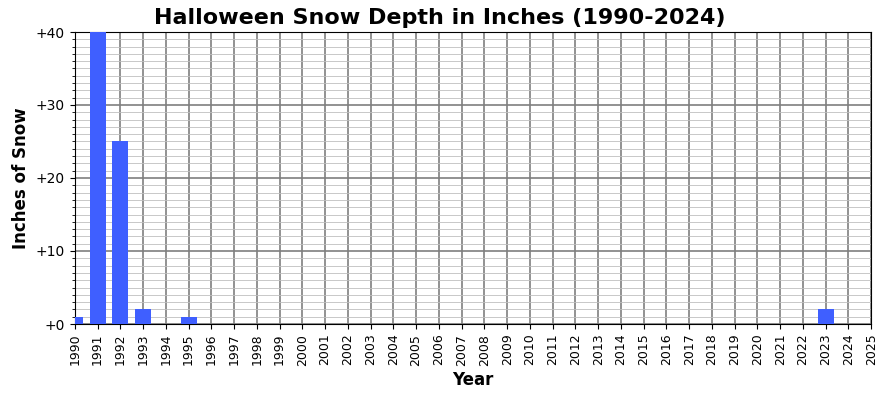
Note the vertical scale change from 20 inches to 40. Even so, the bar for 1991 extends far above the chart to a whopping 126 inches of snow.
Extending the time span to November 12 shows other years where we had some snow in early November:
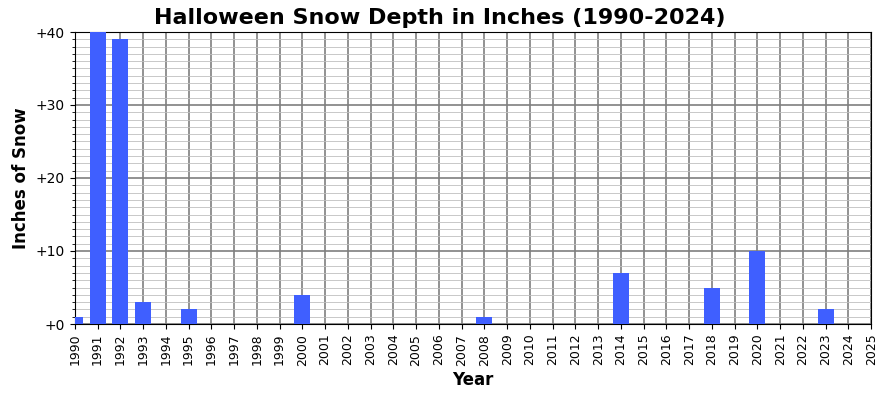
We got a lot of early snow in 1992, but in 1991 after twelve days of snowfall, we had 211 inches of the stuff (and that was just the beginning).
More to the point, as you can see, most years, it hasn’t snowed at all, let alone very much by mid-November.
The second question, snow actually on Thanksgiving, has slightly better odds, even when just looking at the day itself:
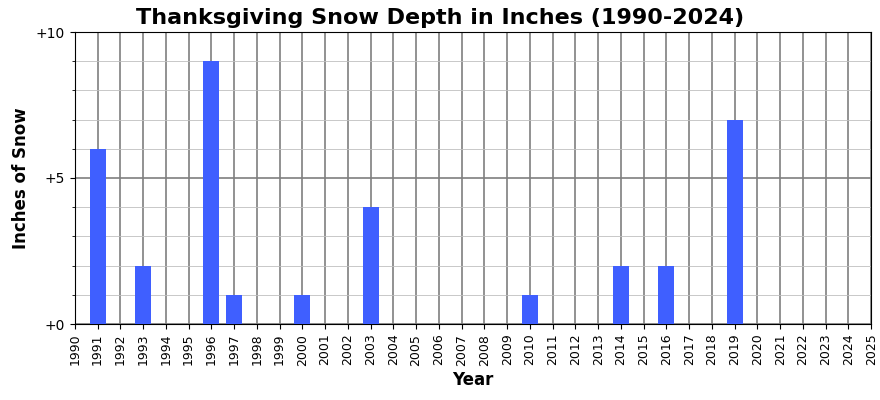
Note the small vertical scale, but an actual snowfall on the day is nice because it makes the day pretty and holiday-like. Sadly, thanks to global warming, we’ve gone without snow most years. In the before times, snow on Thanksgiving wasn’t unusual.
Looking at snow in November up to (and including) Thanksgiving, we have much better odds of a snowy Thanksgiving:
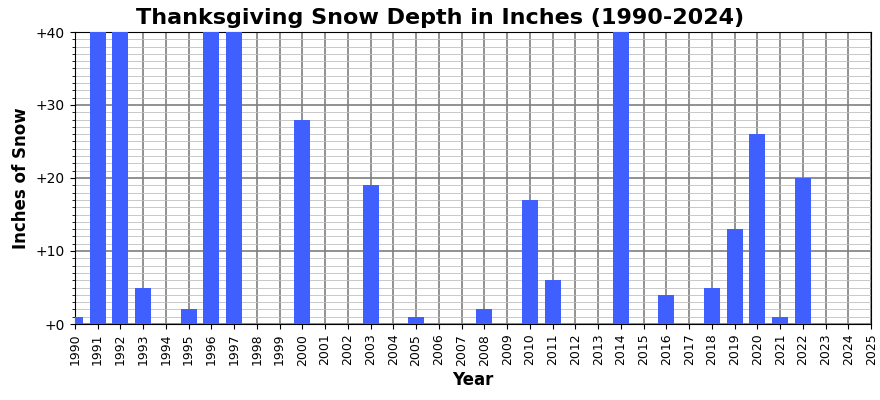
Though this is total snowfall and doesn’t factor in snow that melted. Ideally, I need what the chart title says: snow depth on given days. The data exists, but the charts I made originally were just for snow fall on the day. In fact, the mini-project started off as just wanting to know when (and how much) it had snowed on Halloween. It grew from there to include Thanksgiving and Christmas, the other two snow-related holidays.
A few years go off the chart. In November of 1991, we’d seen 279 inches of falling snow. The next year paled in comparison with only 41 inches (just barely off the chart). In 1996 and 1997 we had 68 and 53 inches, respectively. Then a lot of low-snow Novembers, except for 2014, which is just off the chart with 45 inches.
Note that in all the above charts, the data I currently have ends on November 20, 2024. I need to update my 2020s data file!
We usually do manage to have the traditional “white Christmas”:
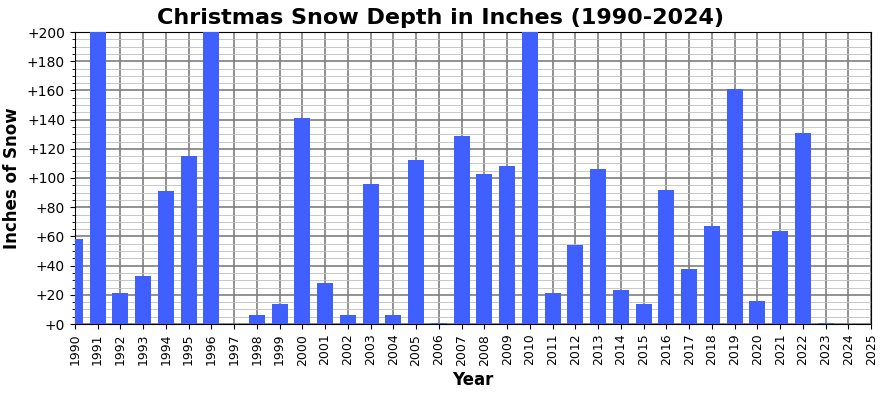
This one shows how much snow fell in December up to and including Christmas Day. Note the enormous vertical scale! Despite that, we’ve had a few bumper crop years: 335 inches in 1991; 234 inches in 1996; 280 inches in 2010. On the other hand, we’ve had a couple of years with no snow in December (1997 and 2006). In years with low snowfall, some years it melted by Christmas.
§
Turning to the weather this past October, last month’s post provided an early peek at some peak weather. Now we can see the whole month:
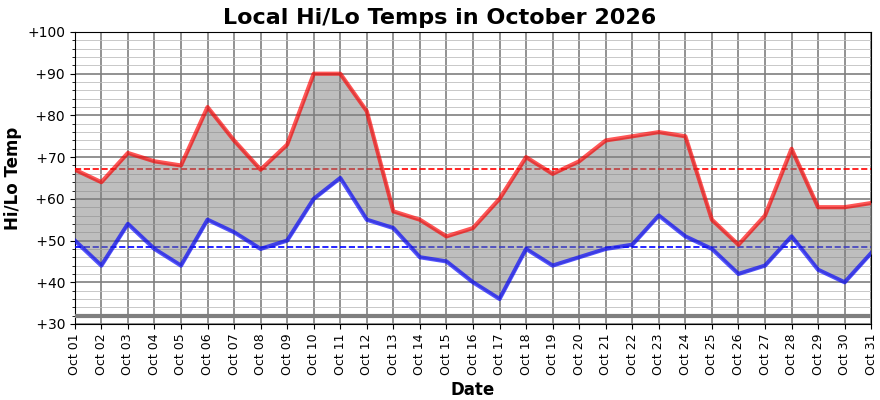
The cool-down we saw in the previous chart ended on the 14th. Here we see it dipped down a little bit more before bouncing back to the 70s. Another cool dip on the 26th, but we had decent weather for Halloween.
And we never dipped below freezing all month.
Comparing October to previous years:
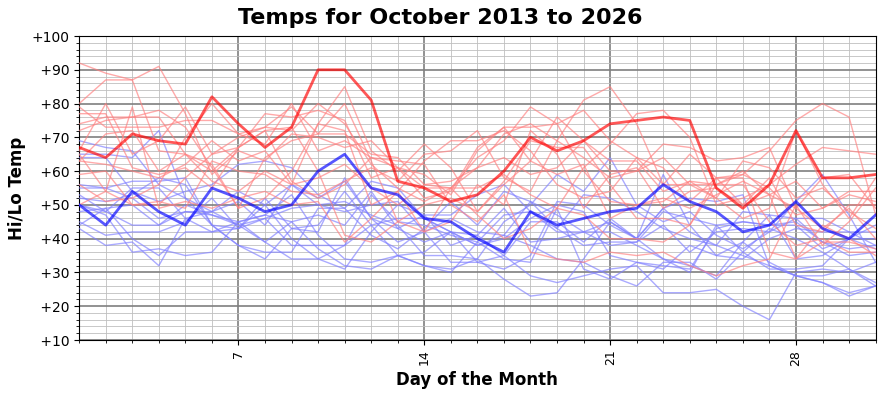
We see another record-breaker on the 24th with near record-breakers for several days before that as well as on the 28th. And Halloween was one of the warmer ones in recent memory.
Breaking high-temperature records in October isn’t new; we did it last year:
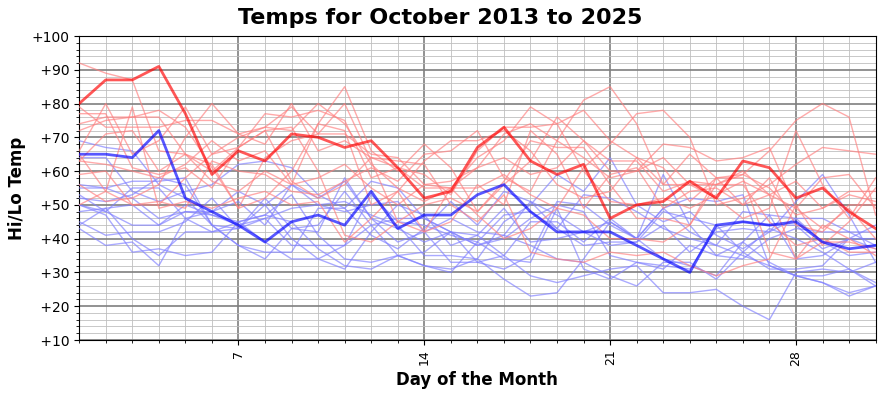
On October 4th, 12th, and 17th, with near record-breakers on other days.
We had a little bit of rain, but not much:
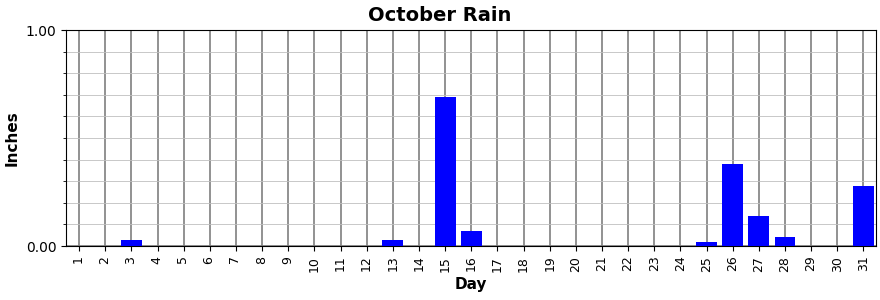
Not enough to eliminate the drought, though it has gotten a lot better for the Twin Cities. Unsurprisingly, no snow during the month.
Our warm October is even more apparent in the Daily Departures from Average chart (based on a 30-year average):
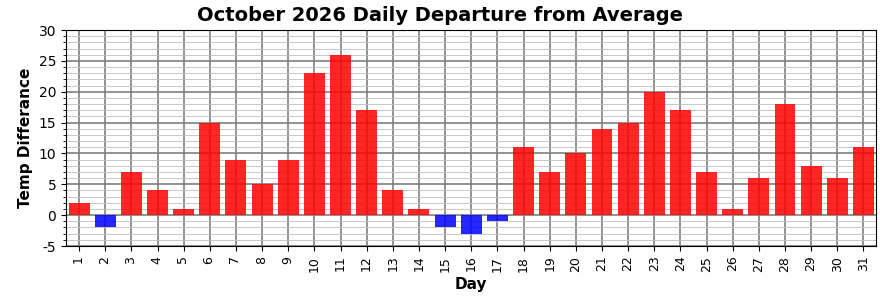
We had a handful of cooler-than-normal days but lots of much warmer-than-average ones. Those record-busters on the 10th and 11th stand above the others, but that bout of 70-degree temps starting on the 18th gives it them some competition.
Regardless, the Heating/Cooling Degree Days chart:
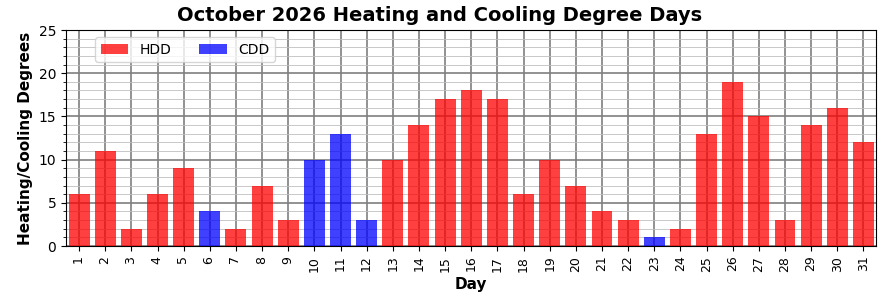
Suggests more heating than cooling, but that’s relative to 65°. The average high was 67°, and the average low was 48°, so most people were indeed doing some heating. I managed to keep my furnace mostly turned off, and I didn’t run the A/C at all because we had good dry air for most of the month:
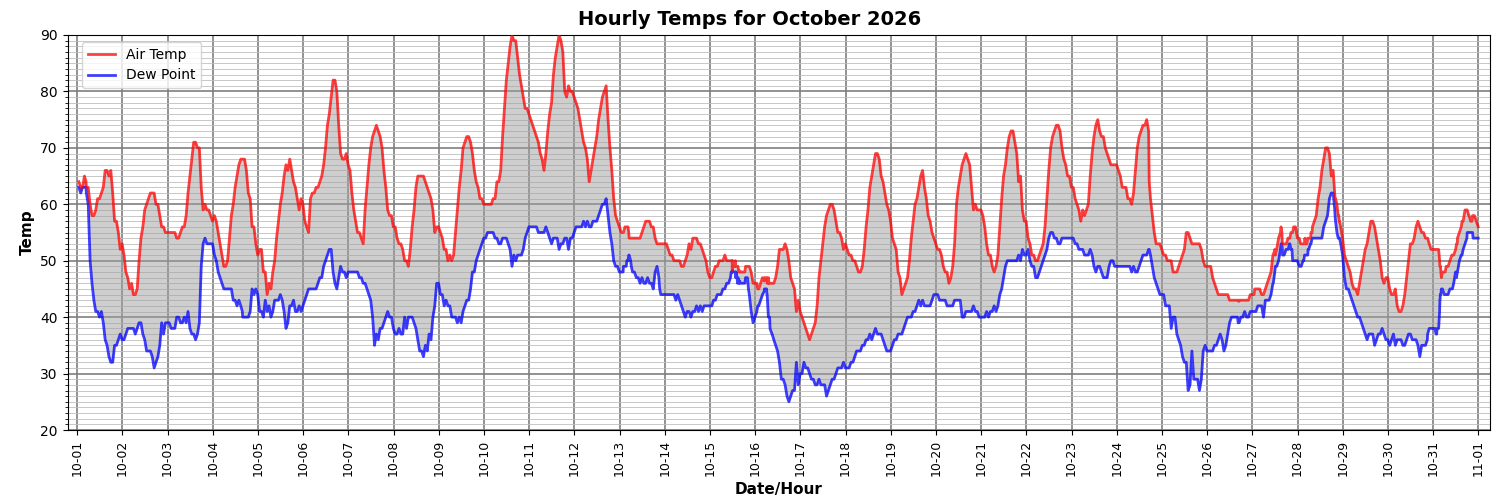
Lots of lovely distance between the temperature and the dew point! Part of the reason I love fall. (Plus: the bugs die and the leaves turn pretty.)
§ §
And that’s the weather.
Stay temperate, my friends! Go forth and spread beauty and light.
∇





You must be logged in to post a comment.