 The Minnesota Twins had another losing season. It was better than last season, but last season was pretty awful (so, a low bar).
This year the Twins finished 77–85 (.475), ranking 19th among the 30 MLB teams (third in their Division). Compared to, in 2025, finishing in 27th place with a 70–92 (.432) record. Of course, no postseason either year.
What’s frustrating is how much potential the team seemed to have this year, yet time after time they just couldn’t leverage that potential.
For at least the two years I’ve done it, the MLB offers “Club TV” — $99 for access to your club’s regular season games (except for “exclusive” games sold to utterly inappropriate outlets like Apple TV). Considering the season is 162 games long over six months, it’s a decent deal.
[Even if as many as 12 games are blacked out, that’s still well under one dollar per game.]
The last two years I’ve also benefited from T-Mobile’s special offer giving customers free access to the MLB app. All the (regular season, non-exclusive) games. Being able to watch any game is a nice perk. Either deal provides access to the MLB archives with past games. (Those blacked-out exclusive games are available in the archive the next day.)
After years of it being a challenge, I’ve been able to enjoy watching baseball regularly. Mitigating that joy is the problem of it being such a time sink. Games last roughly three hours, there are 162 of them in a season, so that’s 486 hours of baseball (just over 20 solid days worth). Spread out over six months (May to September), which helps, but it’s still 81 hours a month..
The end of the season is therefore bittersweet. No more baseball (☹️), but also no more most-evenings-allocated-to-baseball (🥳).
§
How bad was 2026 for the Twins? Bad, but as I said, not quite as bad as last year [see MN Twins 2025 for an account]:
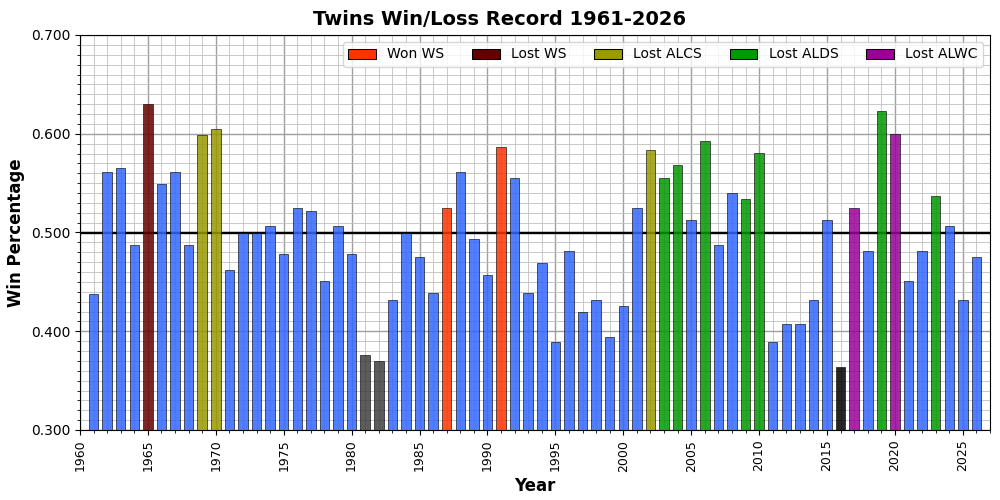
But, ranking 43rd of the 66 seasons since 1961 is still among their more unfortunate years. As the Twins (they used to be the Washington Senators) they have 33 winning seasons (finishing at .500 or above) and 33 losing seasons. In the 33 losing seasons, 2026 ranks #10. At least that’s better than last year, which ranks at #20 in the losing 33 (ranked 53rd in the 66 seasons).
The depressing and self-centered way to look at it is that I spent $99 to watch my team have some of their worst seasons. Not worst-worst, but pretty damn worst. Adding actual injury to the insult, because of the T-Mobile offer, I didn’t have to buy that MLB Club.TV offer in the first place.
Ah, well. So it goes.
It was the first year for manager Derek Shelton, who comes to us after managing the Pittsburgh Pirates since 2020. Before that, he coached for Cleveland, Tampa Bay, Toronto, and even Minnesota (from 2018 to 2019).
Shelton replaces Rocco Baldelli, who managed from 2019 until they fired him last year. He replaced Paul Molitor, who managed from 2015 to 2018. That stretch included 2016, the worst season the Twins ever had. They ended that year with a 59-103 (.364) record. Firing Rocco was a little puzzling because he had a 527-505 (.511) record during his tenure. He was a winning manager overall, though his last season, 2025, was, as mentioned in the lede, pretty bad.
§
The Twins lost for the usual baseball reason: not scoring enough runs to win games. I will give them credit for being shut-out (scoring no runs) only four times in 2026:
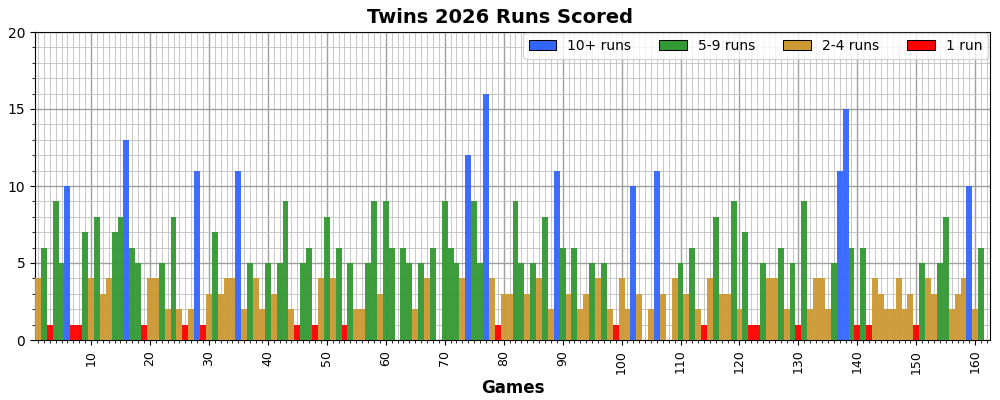
On occasion they scored ten or more runs (the blue bars), but they had 18 games where they scored only one run.
The problem is a bit more apparent when looking at the run difference for each game, the number of runs each game was won or lost by:
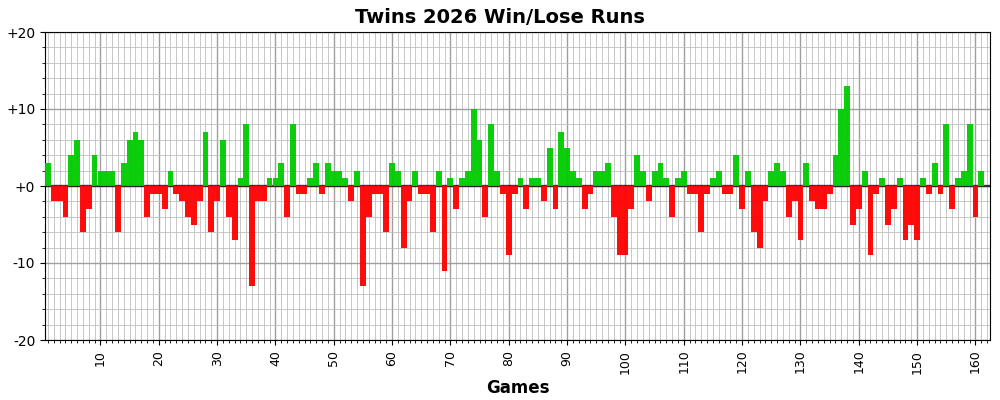
Too much red (lost games). And lots of one- and two-run games. Some blowouts, though usually in lost games. Three times they lost by more than ten runs compared to only one win by more than ten (though there are two games won by ten).
The real issue is apparent when we look at the run differential chart:
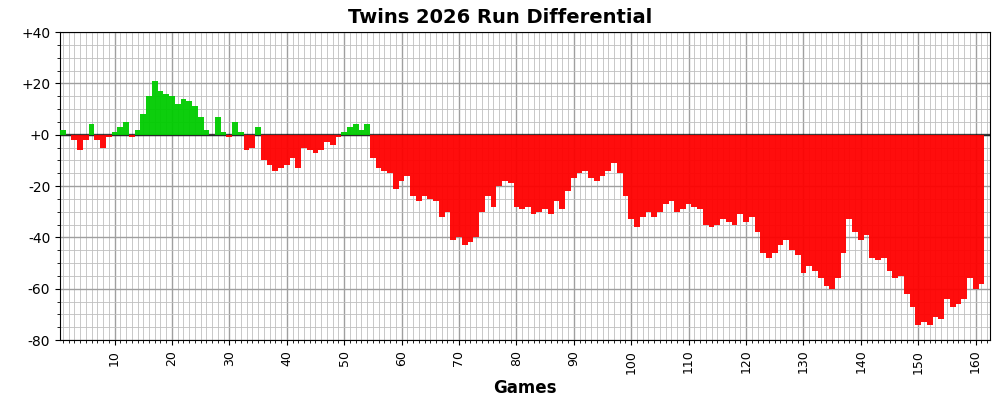
Which shows a pretty disastrous season. They started to recover mid-season, but couldn’t hold it. Some success starting around game 136 reduced the negative run-differential, but they they lost their grip until a notable turnaround starting with game 150.
But far too little too late.
In my head, this chart seemed more interesting than it turn out to be:
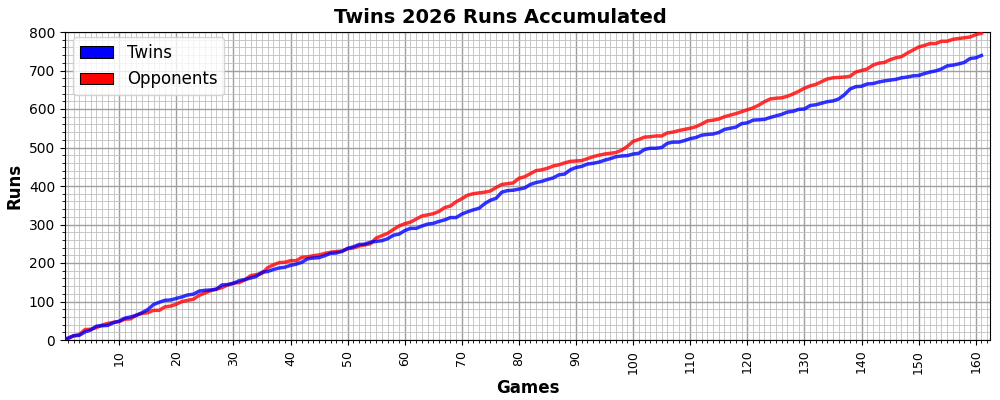
It shows runs scored (blue) and runs allowed (red) over the 162 games of the season. It does indicate that the Twins mostly held their own until about 55 games into the season. They made some recovery around game 95, but then the gap began to widen.
For comparison, here’s the runs accumulated chart for the Brewers:
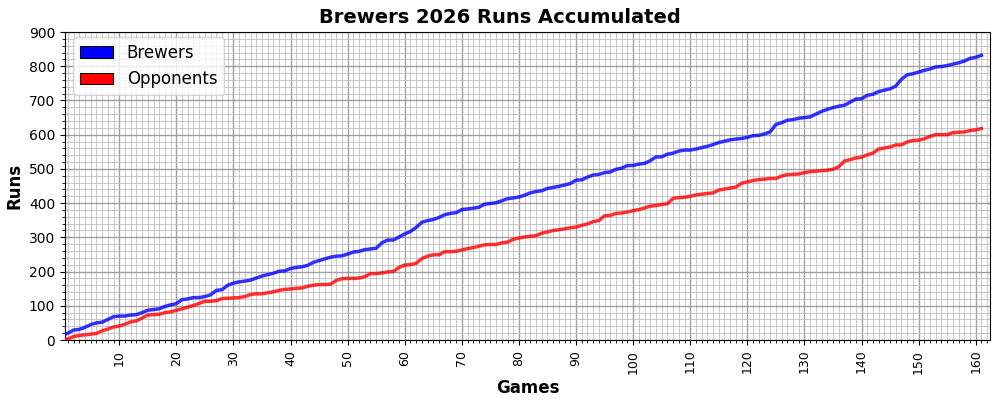
Now that’s a winning team. Their run differential was positive and growing the entire season. Compare that to the last-place Colorado Rockies — who ended their season with a 58-104 (.358) record (ouch):
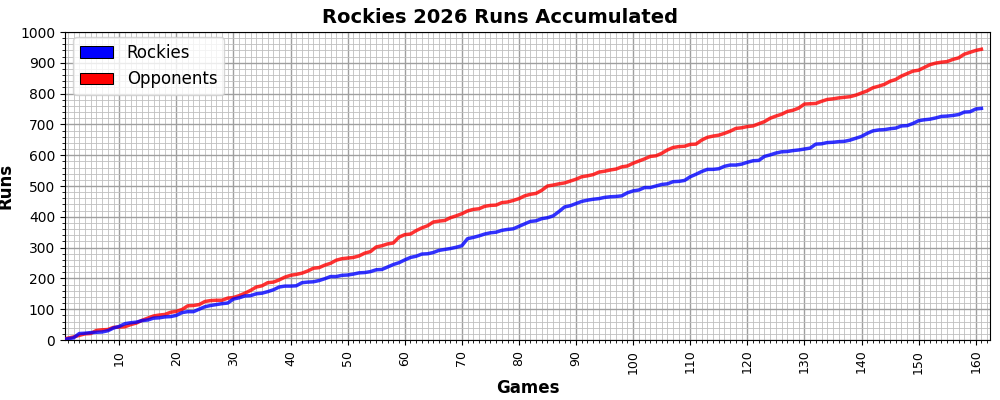
They were behind all season.
Getting back to the Twins, it’s instructive to consider a histogram of runs scored in each game compared to their opponents:
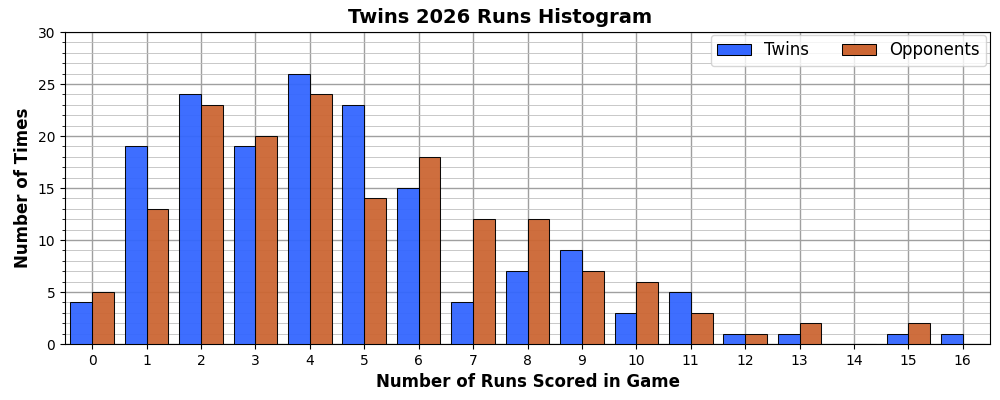
Note how the Twins runs are more clustered towards the left side, whereas the runs they allowed are more apparent on the right side.
Run differential is, I think, one of the more reflective single stats for team performance. Looking at the Twins over the years:
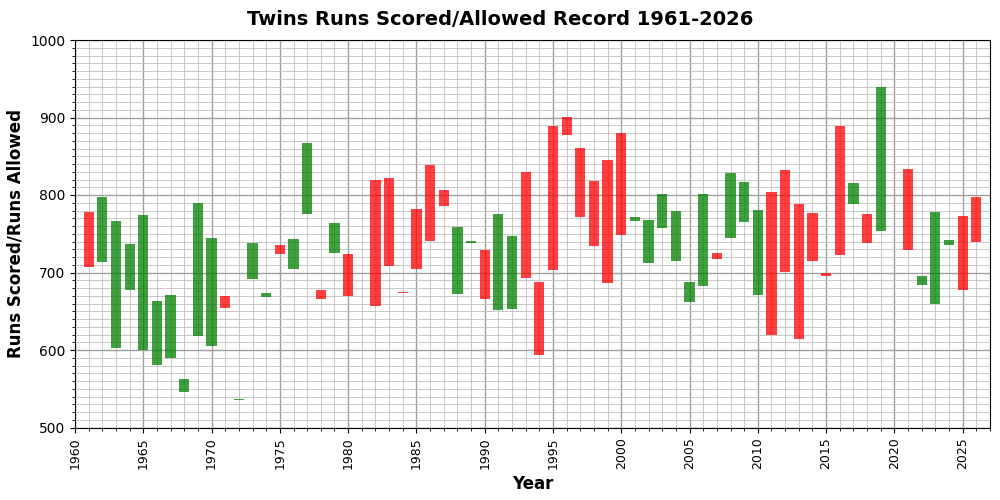
For each year, the top and bottom of the bars indicate the runs scored versus runs allowed. If runs scored were less than runs allowed, the bar is red, and the number of scored runs is the bottom of the bar and the number of runs allowed is the top. If the Twins scored more runs than they allowed, the bar is green, and the top is runs scored while the bottom is runs allowed.
What’s maybe most interesting is how the winning and losing seasons cluster when viewed like this. They had a positive run differential in the early years, but started losing in 1980. That mostly continued until the new millennium, but they started losing again after 2010.
I started getting into baseball and the Twins in 2010, and after that good first year, it was mostly pain through the decade. They did good in 2019, the last year I was tracking all the teams. The regional sports networks started getting weird in 2020, and I lost my ability to watch Twins games.
Around them MLB also began requiring a subscription to access the online XML GameDay data, so I was forced to stop pulling baseball stats data and generating all the reports and charts I’d enjoyed for a decade.
§
Given how little green there is in the 2026 run-differential chart, the win/loss record chart is no surprise (as depressing as it was for the team and the fans):
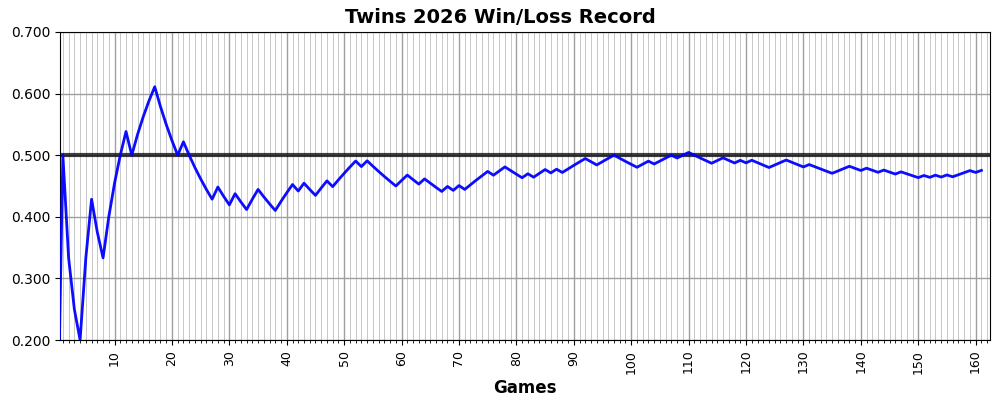
There was a lot of excitement and hope early in the season, but by game 30 the excitement dissipated and the hope diminished. They managed to poke their heads above the .500 mark just once for game 110, but they were otherwise below water the rest of the season.
Their performance month-to-month, especially in June and July, seemed to give hope for a strong finish:
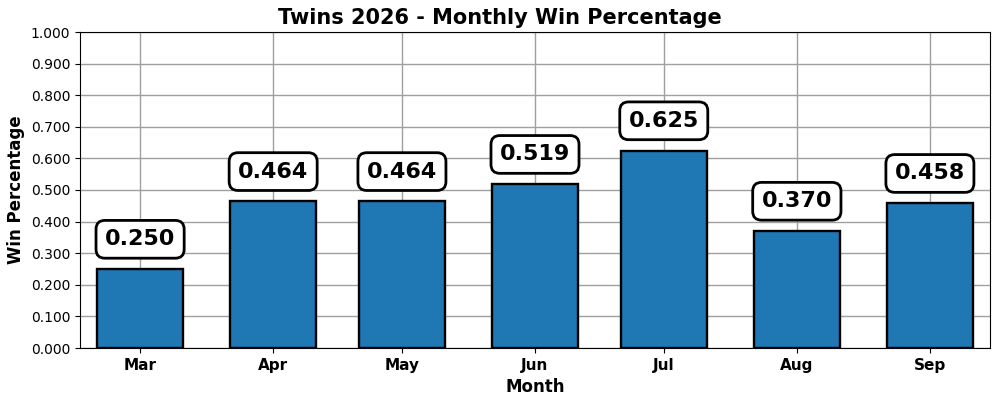
But they collapsed in August and only slightly recovered in September. But of the six months (March doesn’t count: only four games), they were at .500 or better in only two of them. Definitely not a winning season.
§
But since the entire Division was weak, with only two teams finishing above .500 (Cleveland and Chicago), the Twins managed to finish third in the Division:
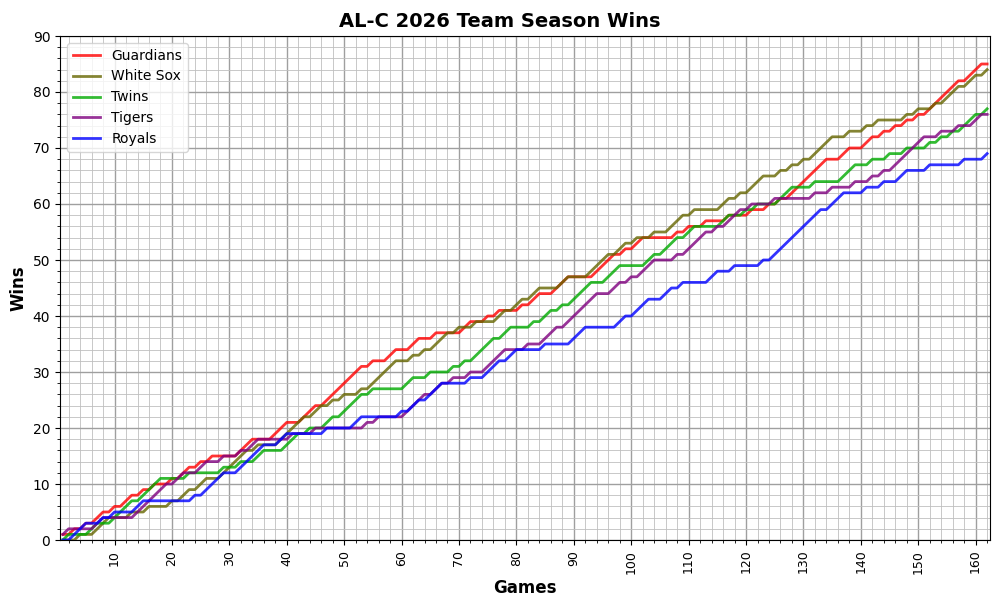
In a very close tie with Detroit. And note how close the top two teams were. Weak as the Division was, it was an interesting race. The Twins stayed roughly in the middle of the pack. The poor Royals pretty much stayed at the bottom of the pack. The Guardians and White Sox went back and forth for first and second place.
Looking at the whole American League:
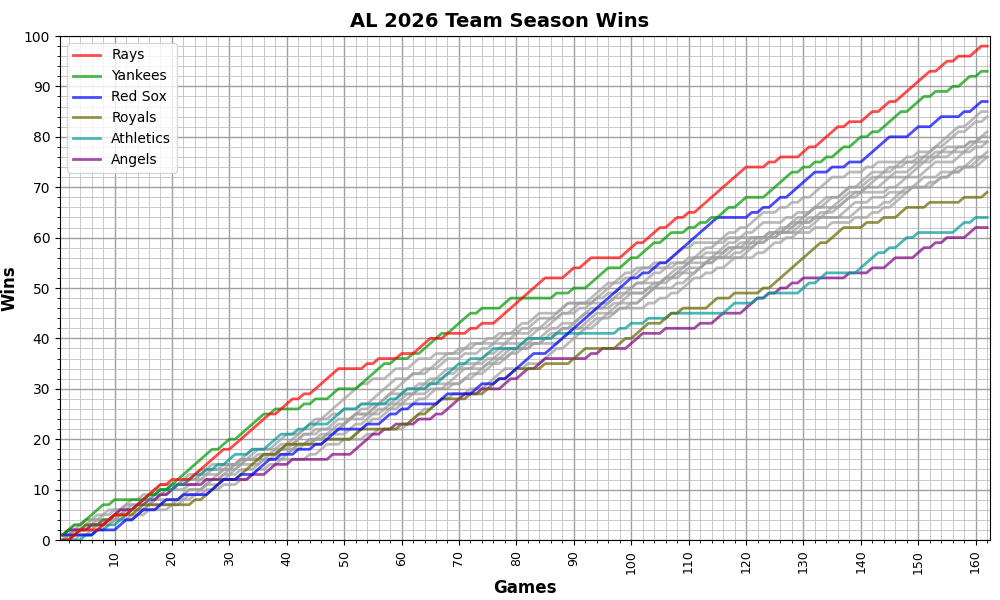
The Rays were dominant all year. The Red Sox made a mid-season push to come from behind to take second-place in the AL-East. That won them a Wildcard spot, but they had to face the division winner, the Yankees, and lost 0-2. The Athletics and Angels were losing teams all year. The Royals mostly were, but they had a hot streak late.
Singling out the Twins in the American League race:
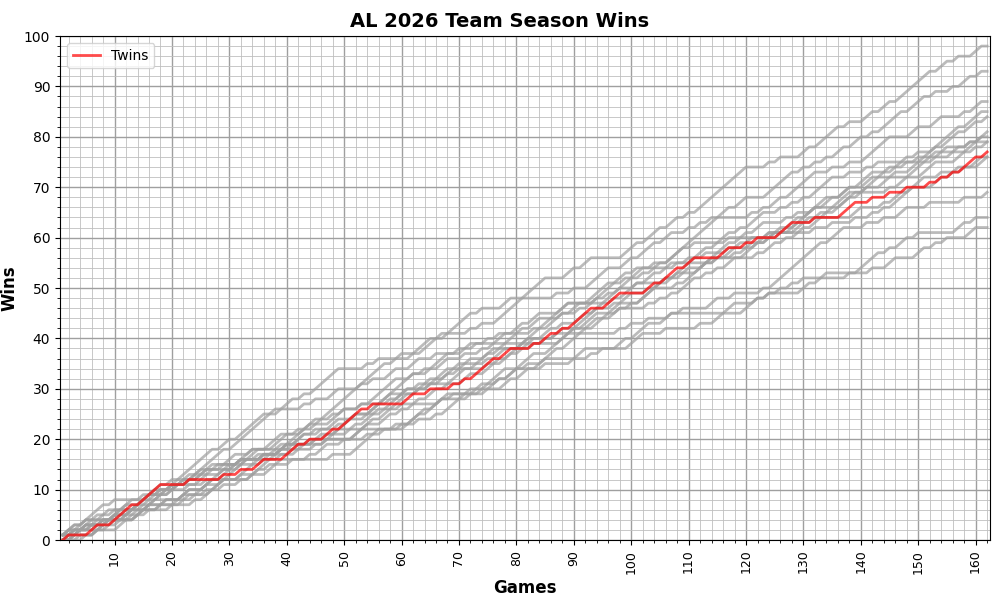
They lagged behind most of the 15 clubs and finished 10th.
Looking at the 30 teams in the MLB:
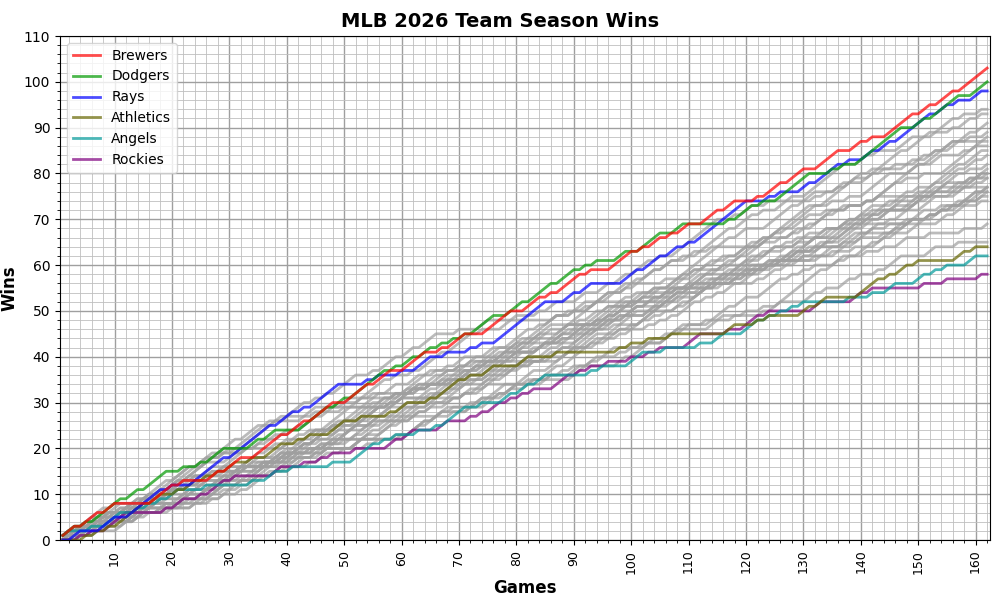
The Brewers, Dodgers, and Rays were all in a pretty tight race. Even worse than the Athletics and Angels were the Rockies (to no one’s surprise).
Again singling out the Twins:
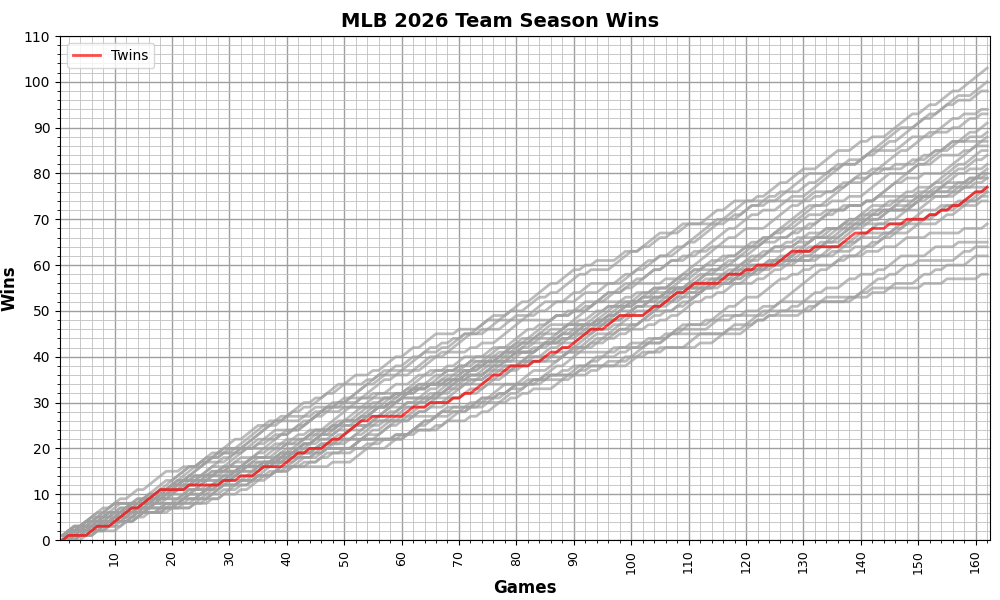
Not the worst team, but definitely behind in the pack. A lot more gray traces above them than below.
For completeness, here’s the whole National League:
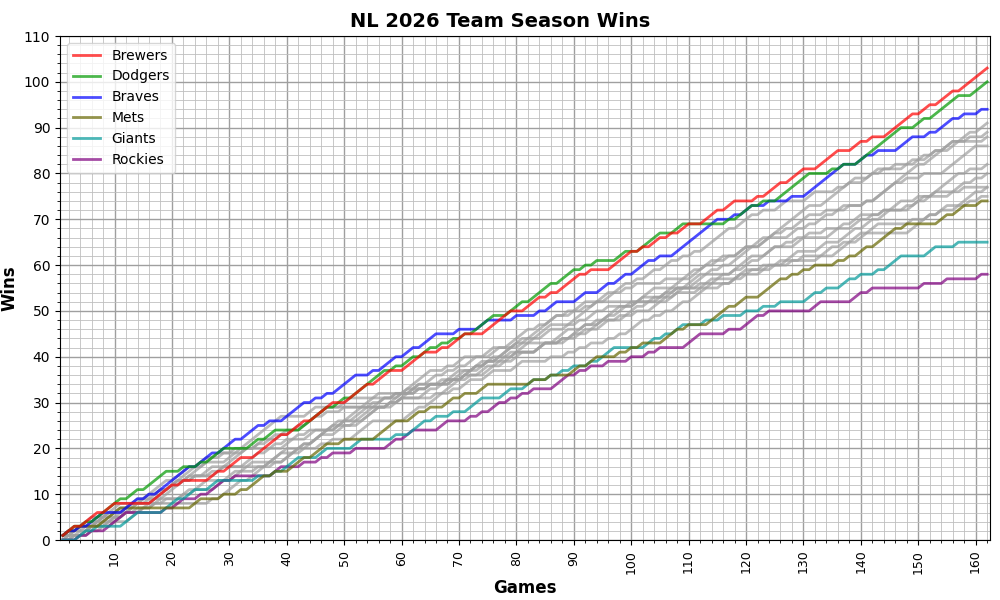
The Brewers, Dodgers, and Braves dominated their respective divisions and the NL in general. The poor Rockies and Giants were never contenders. The Mets managed to get to the back of the back in the last third of the season.
§
I’ll end with three charts tracking home runs, strikeouts, and walks for the MLB as a whole and for just the Twins. These three at-bat results are known as the Three True Outcomes (TTO), and there is concern that the modern focus on these is detracting from exciting games with the ball in play.
The theory behind the TTO is that those results do not put the ball in play and, other than the strikeouts, can’t result in outs. But only walks put runners on base, and all the strikeouts are boring for fans.
And strikeouts have definitely been on the rise over the years:
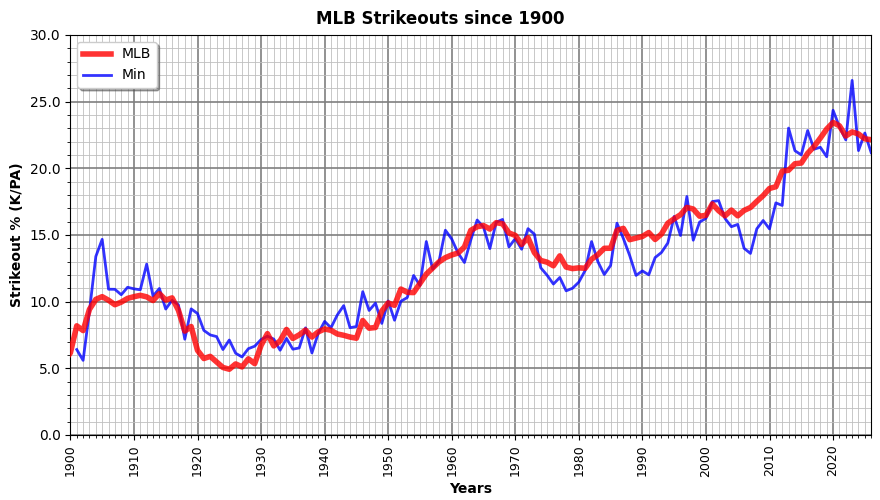
Though there seems some drop in recent years. The Twins have, generally speaking, been close to the MLB average.
Walks have mostly remained steady:
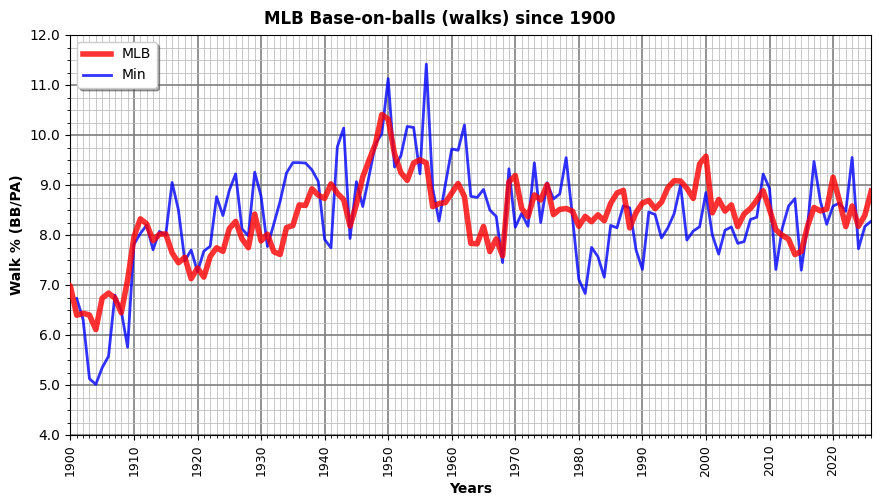
Note the vertical scale change. Since the early 2010s, more than 20% of plate appearances end in strikeouts, but walks have been under 10% for many decades.
Lastly, the home runs:
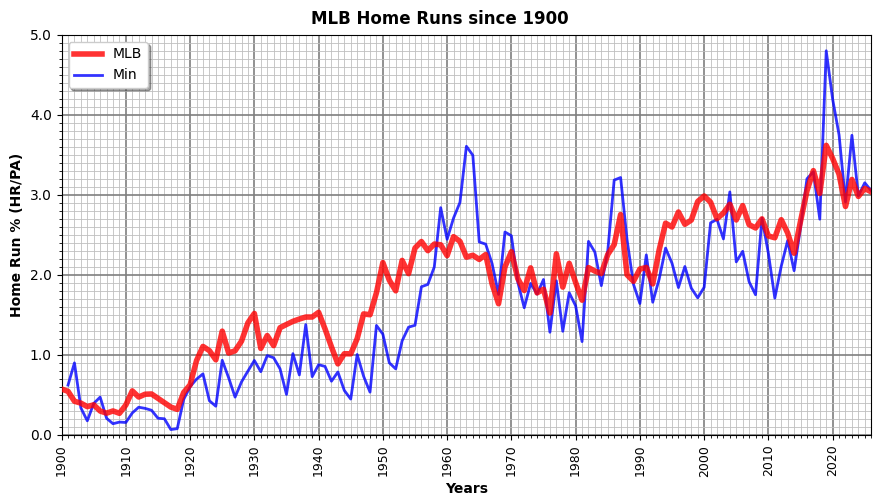
Which are certainly crowd-pleasers and which have also been steadily on the rise over the last century. Again note the vertical scale change. Home runs are more rare than walks, and much more rare than strikeouts.
Walks may have remained mostly steady, but home runs and strikeouts have increased notably during the last century. Quite a mixed blessing. We fans love the home runs but hate the strikeouts.
§ §
Hopefully, next year will be better for the Twins.
Stay on base, my friends! Go forth and spread beauty and light.
∇






You must be logged in to post a comment.