 I don’t know why I’m so fascinated that the rational numbers are countable even though they’re a dense subset of the uncountable real numbers. A rational number can be arbitrarily close to any real number, making you think they’d be infinite like the reals, but in fact, nearly all numbers are irrational (and an uncountable subset of the reals).
So, the rational numbers — good old p/q fractions — though still infinite are countably infinite (see this post for details).
More to the point here, a common way of enumerating the rational numbers, when graphed results in some pretty curves and illustrates some fun facts about the rational numbers.
This started because I was sitting listening to music and was doodling and free associating. I got to thinking about how the common way to enumerate the set of rational numbers outputs a list of chains of fractions. Each chain has one more fraction than the previous, so their lengths grow towards infinity.
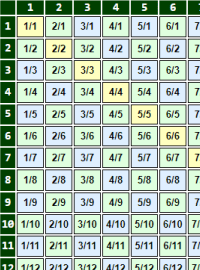
Crucially, each fraction in a given chain has the same numerator-denominator sum. Further, that sum identifies (or indexes) the chain. For example, the #4 chain is:
![\displaystyle\left[\,\frac{0}{4},\;\frac{1}{3},\;\frac{2}{2},\;\frac{3}{1}\,\right]](https://s0.wp.com/latex.php?latex=%5Cdisplaystyle%5Cleft%5B%5C%2C%5Cfrac%7B0%7D%7B4%7D%2C%5C%3B%5Cfrac%7B1%7D%7B3%7D%2C%5C%3B%5Cfrac%7B2%7D%7B2%7D%2C%5C%3B%5Cfrac%7B3%7D%7B1%7D%5C%2C%5Cright%5D+&bg=f9fbf9&fg=000080&s=1&c=20201002)
Note how the numerator (p) and denominator (q) of each fraction sum to 4. Note also that the chain has four members. Lastly, note that there is no 4/0 fraction because division by zero is undefined. Therefore, the last member of the chain has the value one-minus-the-sum. Of course, the first member always has the value zero.
As another example, here’s the #9 chain:
![\displaystyle\left[\,\frac{0}{9},\;\frac{1}{8},\;\frac{2}{7},\;\frac{3}{6}\,\;\frac{4}{5},\;\frac{5}{4},\;\frac{6}{3},\;\frac{7}{2},\;\frac{8}{1}\,\right]](https://s0.wp.com/latex.php?latex=%5Cdisplaystyle%5Cleft%5B%5C%2C%5Cfrac%7B0%7D%7B9%7D%2C%5C%3B%5Cfrac%7B1%7D%7B8%7D%2C%5C%3B%5Cfrac%7B2%7D%7B7%7D%2C%5C%3B%5Cfrac%7B3%7D%7B6%7D%5C%2C%5C%3B%5Cfrac%7B4%7D%7B5%7D%2C%5C%3B%5Cfrac%7B5%7D%7B4%7D%2C%5C%3B%5Cfrac%7B6%7D%7B3%7D%2C%5C%3B%5Cfrac%7B7%7D%7B2%7D%2C%5C%3B%5Cfrac%7B8%7D%7B1%7D%5C%2C%5Cright%5D+&bg=f9fbf9&fg=000080&s=1&c=20201002)
Note that it has nine members. The last one has the value eight (one-minus-the-sum), and the first has the value zero. Note also that, because it’s an odd-numbered chain, its fractions straddle the value of one. The #4 chain above, because it’s even-numbered, has a fraction in the middle with the value of one.
The shortest possible chain, the #1 chain, is just [0/1], which evaluates to [0], so it doesn’t have much graphic potential (but might be useful if we turn this into a group and need an additive identity element). The shortest chain with length, the #2 chain is:
![\displaystyle\left[\,\frac{0}{2},\;\frac{1}{1}\,\right]](https://s0.wp.com/latex.php?latex=%5Cdisplaystyle%5Cleft%5B%5C%2C%5Cfrac%7B0%7D%7B2%7D%2C%5C%3B%5Cfrac%7B1%7D%7B1%7D%5C%2C%5Cright%5D+&bg=f9fbf9&fg=000080&s=1&c=20201002)
And, as mentioned, there’s no ceiling on chain length. It’s whatever the chain’s number is.
§
Crucial for the graphs, the fractions in a chain can be evaluated as decimal numbers. They all have numeric values, and those values are interesting to us. Or to me, anyway. Those values are what I noticed while doodling.
For instance, the #4 chain listed above has the values:
![\displaystyle\left[\,{0},\;{{0.}\overline{333}},\;{1},\;{3},\right]](https://s0.wp.com/latex.php?latex=%5Cdisplaystyle%5Cleft%5B%5C%2C%7B0%7D%2C%5C%3B%7B%7B0.%7D%5Coverline%7B333%7D%7D%2C%5C%3B%7B1%7D%2C%5C%3B%7B3%7D%2C%5Cright%5D+&bg=f9fbf9&fg=000080&s=0&c=20201002)
The #9 chain listed above has the values:
![\displaystyle\left[\,{0},\;{0.125},\;{0.2857\!\ldots},\;{0.5},\;{0.8},\;{1.25},\;{2},\;{3.5},\;{8}\,\right]](https://s0.wp.com/latex.php?latex=%5Cdisplaystyle%5Cleft%5B%5C%2C%7B0%7D%2C%5C%3B%7B0.125%7D%2C%5C%3B%7B0.2857%5C%21%5Cldots%7D%2C%5C%3B%7B0.5%7D%2C%5C%3B%7B0.8%7D%2C%5C%3B%7B1.25%7D%2C%5C%3B%7B2%7D%2C%5C%3B%7B3.5%7D%2C%5C%3B%7B8%7D%5C%2C%5Cright%5D+&bg=f9fbf9&fg=000080&s=0&c=20201002)
The #2 chain obviously evaluates to [0, 1]. (Remember that all chains start with zero and end with the sum minus one.)
I began to wonder what a graph of those chains would look like. The code seemed dead easy to write, and it was:
002|
003| def fraction_list (n):
004| “””Fraction chain generator.”””
005| p = 0
006| q = n
007| while 0 < q:
008| yield (p,q)
009| p += 1
010| q -= 1
011|
012| for n in range(number_of_chains+1):
013| for p,q in fraction_list(n):
014| print(‘%2d: %d/%d; %.6f’ % (n,p,q,p/q))
015| print()
016| print()
017|
018|
Hand that off to some boilerplate matplotlib code, and voilà:
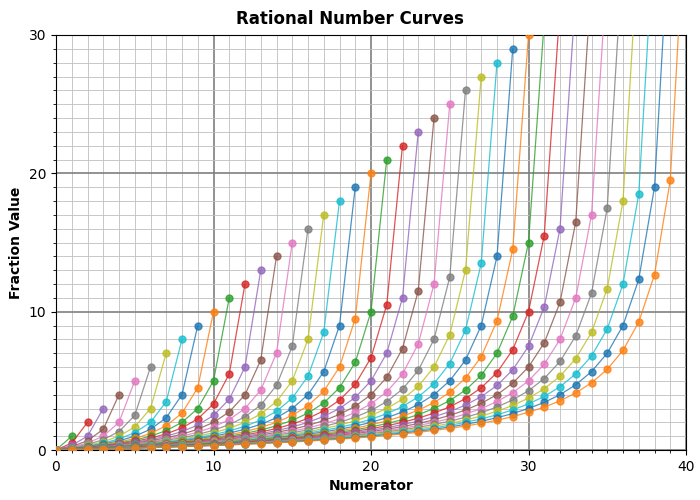
Chart 1. Fraction chains from #2 to #40.
Kind of pretty! Each line traces one fraction chain. Each dot represents one fraction.
Remember, all chains start at zero (in the lower-left corner). Each chain ends at their sum-1 max value — that top-most angled row of dots. For example, the orange dot at coordinates (20,20), just above the center of the graph, is the end of the #21 chain. That dot is the fraction 20/1, hence the y-value of 20.
The x-axis is the fraction’s numerator. The orange dot just mentioned has a numerator of 20, hence the x-value of 20.
It’s not obvious in Chart 1, but each chain has half its length above 1.0 and half its length below. As mentioned above, the even-numbered chains all have a fraction that evaluates to exactly 1.0, but the rest are split half above 1.0 and half below. The odd-numbered chains, which lack a center member with the value 1.0, have exactly half their members above and half below.
[The sole exception is the #2 chain, which has members only at zero and one. It has a member with the value one, but that member isn’t in the center.]
These chains feature a large jump in value between the penultimate fraction and the ultimate one. That last fraction always has the value of some m/1 (or just m, and note that m=n-1, where n is the chain number.).
But the second-to-last fraction always has the value:

Which is slightly less than half, so that last step is a doozy and keeps getting bigger! The larger m gets, the larger the last step is (always roughly m/2). As Chart 1 shows, the steps become smaller going down the chain (towards zero). For example, the third-to-last fraction has the value:

So less than one-third of whatever m was.
The end result is that fractions in the “upper” half of the chain are as spread out as the “lower” half is compressed between zero and one.
This next chart zooms in on lower region of y-values:
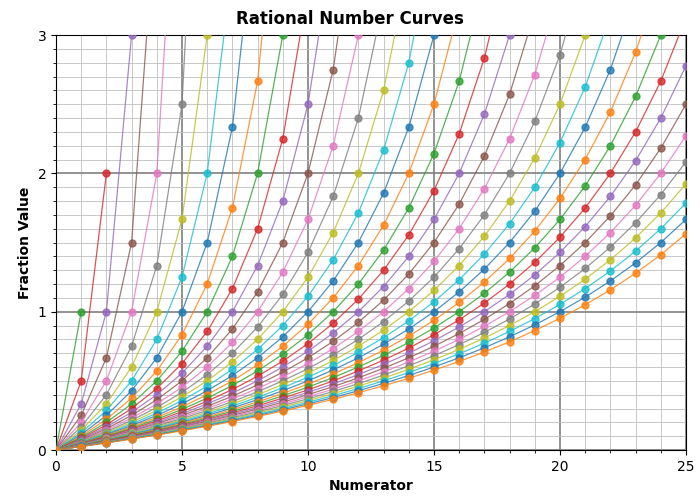
Chart 2. Same chains but graph is zoomed in on a 25 × 3 window.
Note that the y-axis only goes up to 3.0 now and the x-axis to 25.0. Importantly, note all the fractions (dots) below the horizontal 1.0 y-value. Also note how only every other chain (the even-numbered ones) has a fraction that evaluates to 1.0 (has a dot directly on the 1.0 y-value).
For bonus credit, note that on the 2.0 y-value, it’s every third chain with a fraction that has a value of exactly 2.0 (for instance 2/1, 4/2, 10/5, 26/13, and so on). For the 3.0 y-value, it’s every fourth chain. (Can you see why that pattern exists?)
Just for fun and because it’s free, here’s a slightly closer zoom:
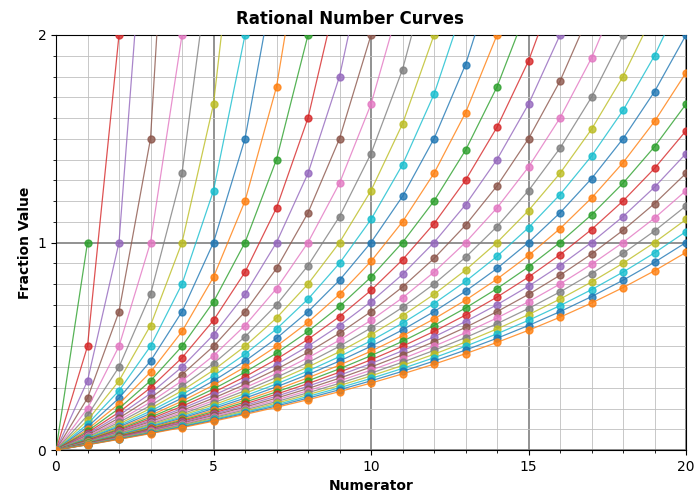
Chart 3. Same chains but zoomed in to 20 × 2.
If you look closely, you might see how the dots from different chains also make patterns. A very noticeable one starts in the lower-left corner, rises quickly (red dot) and then forms a curve that approaches but never meets the 1.0 y-value line.
That curve is mirrored by one that starts in the upper left and sweeps down towards, but never meeting, the 1.0 y-value line from above. There is a whole series of such curves approaching that line.
Similar curves can be found approaching other horizontal value lines but increasing sparsity of dots above 1.0 makes them hard to spot.
Here’s a final zoom to really show off the population of fractions with values below 1.0:
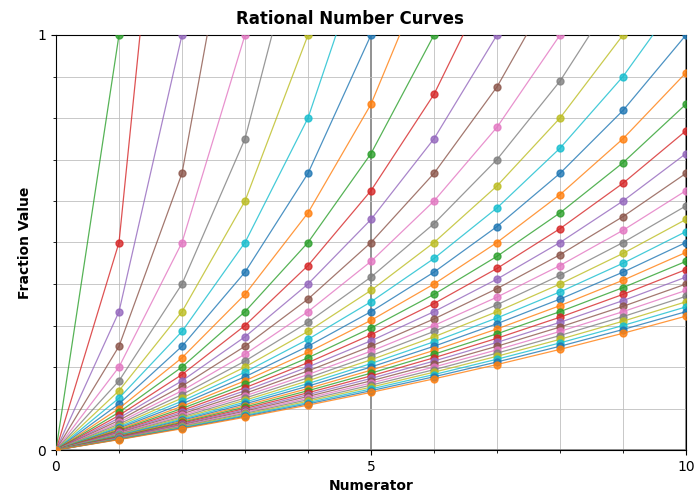
Chart 4: The final zoom. Down to 10 × 1!
For any given numerator, the fractions become closer and closer together as chains pile on. For instance, the blue dot on the top edge at center, on the vertical x-value line 5, is a fraction from the #10 chain. It has the value 1.0 and the sum 10, so the fraction is 5/5. Going down the vertical line, the values are:

The values get smaller and smaller. The values start at 1.0 with 5/5, but five chains later it’s down to 5/10 — 0/5. The lowest dot on the line (the orange one at the bottom) is 5/36 (0.1388).
§ §
I wondered what the graph of the chains would look like, and now I know. They’re kind of cool. It almost looks like the growth rate isn’t exponential but something similar. The curve seems to have a different shape than an exponential one.
I’m probably wrong about that. It’s probably exponential and the exponent is a function rather than a constant. Something to think about when I’m listening to music.
Stay fractional, my friends! Go forth and spread beauty and light.
∇


April 22nd, 2023 at 10:13 am
“And now for something completely different!” 😎
April 22nd, 2023 at 5:22 pm
BTW: You can click on the charts for a larger version.
April 22nd, 2023 at 10:31 am
On any given vertical line (given numerator), the top-most fraction is always x/1, where x is the numerator. Going down from the top-most, the sequence is simply:
Where N is the number of chains. The length of these sequences is obviously constrained by both x and N (the longest sequence for a given N occurring when x=1).
February 26th, 2024 at 12:16 pm
[…] The rational numbers, while infinite, are still countable (or more precisely, enumerable). [See More Fraction Fun for […]