 Or do I mean Logic Square? Because it works either way. The Logic Square (or Square Logic) in question is a logic game created by Charles Lutwidge Dodgson (1832-1898) and introduced in his 1896 book Symbolic Logic Part I (a second part was published posthumously).
Dodgson was a capable mathematician, but most probably know him by his penname, Lewis Carroll, under which he wrote poetic fantasy fiction about a girl who goes on wild adventures.
But this is about his logic game. It’s like a square Venn diagram with game pieces.
John Venn (1834–1923) introduced his now well-known logic diagram method in 1880, which predates Carroll’s book by eighteen years. [See 180 Years of Venn.] Blaise Pascal (1623–1662) introduced his famous Wager in the 17th century, and although Pascal didn’t use one in his argument, the logic behind it easily translates to the four-square diagram Carroll used. [See Embracing the Wager.] It can also translate to a Venn diagram, but the four-square diagram presents the case more clearly.
[As a reference point, George Boole, who introduced Boolean Algebra, lived from 1815 to 1864. The idea of logic is ancient, but the mathematical quantification of it seems to have begun around the 19th century.]
So, I doubt Carroll actually invented the four-square diagram. His addition may be the use of markers and the way of combining two of them. Unlike trigonometry, which once learned continues to be a useful tool, this is almost entirely recreational. Possibly educational for someone learning logic. And I suspect most will find the basics familiar.
§
Since I’m sure the basics are familiar, I’ll get right to it. A four-square logic diagram is exactly what its name implies: a square divided into four parts (like a window with four panes):
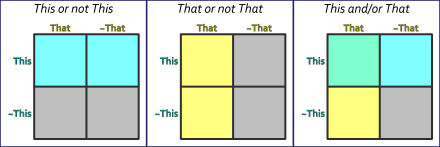
Figure 1. Basic four-square diagrams (with logic highlighting).
You’ve probably seen this used more than once. I’ve used it in this blog more than once. [For instance, see Window with a Worldview.] Figure 1 shows three versions of a four-square diagram. Such diagrams, like Venn diagrams, have two properties, each of which can be true or false. In the examples above the two properties are This and That.
Specifically, we imagine a universe of discourse — a world of objects under (logical) discussion. In this case, the universe contains unspecified objects, but we assert they have the property of This and That, and these can be either true or false.
[For such simple logic, we assume the excluded middle. If a proposition is not true, it must be false. If it’s not false, it must be true. No middle ground.]

Figure 2. The Venn diagram version of Figure 1.
Combining two logical properties in a logical expression is as common as adding two and two. Venn diagrams use circles to represent the two properties.
Where the circles overlap, both properties are true. The background area represents the case that both properties are false.
This works great if your focus is the intersection of the two — the place where both properties are true. Especially if you don’t care about the case where both are false. In most Venn diagrams, that case — the background — is generally ignored as irrelevant.
In contrast, four-square diagrams give equal weight to all four possible cases: both true, both false, one true with the other false, and vice versa. Pascal’s Wager is a good example of a case where all four combinations are significant.

Figure 3. Venn diagram focused on the intersection.
Figure 3 is a good example of a Venn diagram with an irrelevant background. The vast population of people (the universe of discourse) who neither invented diagrams nor were born on Aug 4, 1834, is irrelevant to the small joke involved.
[Doubly cool image. Firstly, in that Venn diagrams are lingua franca enough to be used as jokes. Secondly, that it’s the perfect vehicle to express this joke. In fact, it doesn’t really work any other way. Hugely clever. Wish I’d thought of it.]
But something like Pascal’s Wager, while it can be expressed as a Venn diagram (an exercise for the reader), actually works better in four-square form because all four cases bear examination. They’re all equal in being possible outcomes.
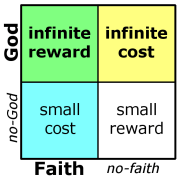
Figure 4. Pascal’s Wager.
The technique is simple. The rows represent one property, and the columns represent the other. The four (geometric) intersections represent the four possible combinations of outcome: true–true, true–false, false–true, false–false.
In a Venn diagram version of Figure 4, the lower-right square, “small reward”, would be the background of the Venn diagram. The two circles would be God (exists or doesn’t) and Faith (you have it or don’t). The intersection (upper left) is indeed the payoff, but I don’t think the Venn version expresses the logic as clearly.
§ §
Lewis Carroll adds two new wrinkles to what I imagine is an older idea. (His book explains four-square logic in great detail and seems to assume it’s new to the reader, so who knows.) The first wrinkle introduces two kinds of markers to the four-square diagram (the “game pieces” I mentioned above). These markers come in red and gray.

Figure 5. Some This is That (and some That is This).
Consider the This and That proposition diagrammed in Figure 5. (The same proposition is diagrammed in Figure 1 above.)
The red marker asserts that the case in question, that both This and That are true, has at least one instance. There is at least one case where This and That are both true.
It’s the logical equivalent of the formal logic proposition, “some This is That.” Equally, that “some That is This.”
There is a crucial point here: we are not making any assertions about the other three cases (squares). The marker only makes an assertion about the square it’s in (although we’ll expand on that just slightly below).
BTW: The tilde (~) in the diagram is one of the several ways to indicate logical NOT, so the columns are (left to right) That and NOT That, while the rows are (top to bottom) This and NOT This.
§

Figure 6. No This is That (and No That is This).
Figure 6 shows the same proposition, but now we use a gray marker to assert a case is never true. There is no case where both This and That are true.
The logical proposition is “no This is That.” And alternately, “no That is This.”
Again, we assert no information about the other three cases. There may be instances where they’re true, or there may not be.
The diagram shows us that the potential combinations, but whether they are actually populated by any objects from our universe of discourse is not part of the proposition. We only know that in no case are the properties This and That both true.
A word about words: objects from our universe can have properties which here can be true or false. We don’t say an object has a color property, which can be red, green, or whatever, but that it has a red property, which can be true or false. The object also has a green property and so on for any colors we care about. Boolean properties can only be true or false. A proposition (or logical clause) is a statement about two such properties. For example: “No This is That.”
§
The above cover two of the classical forms of proposition, Some X is Y, and No X is Y. A third form, All X is Y, takes a little thought. Carroll goes over it in detail in his book. Here I’ll just say that it’s two propositions in one: Some X is Y, and No X is not Y.
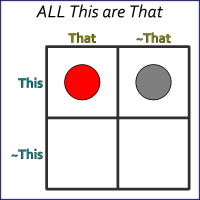
Figure 7. ALL This are That, but not necessarily vice-versa.
Figure 7 illustrates using the two markers we’re now familiar with. The combination means that, if This is true, then That must also be true.
Note that it does not mean the opposite. The diagram shows there are instances where That and This are both true, but it makes no assertion about the case where That is true, and This is false. Might happen; might not.
The formal proposition is that “all This are That.” (And just to reiterate, the opposite cannot be stated from the information given. We can only say that “some That are This.”)
There is a fourth classical proposition form: Some X are not Y, but in a four-square diagram this is the same as Some X are Y (Figure 5). The only difference is a different square for the marker. Likewise, the propositions Some not X are Y and Some not X are not Y, both involve a single red marker in the appropriate square.
§

Figure 8. All dogs have 4 legs.
And that’s all you have to know about the markers. Red means there is at least one instance in the case marked, gray means there is no instance in that case.
Let’s exercise this with a simple example, one you may have run into before (perhaps even on this blog):
All Dogs have Four Legs.
Figure 8 illustrates this graphically. The proposition starts with “all dogs”, so we use the two-marker form to assert that in our universe of discourse, all objects there that are dogs also have four legs. We’re not saying anything about things that aren’t dogs (the lower row). Nor are we asserting anything else has, or doesn’t have, four legs.
It’s worth mentioning here that logic is entirely about syntax, not semantics. Logic is about the form of the argument, not the content. In particular, as they say, garbage in, garbage out (GIGO). Logic ensures the correctness of the argument, that if the premises are true, then the conclusion must be true. But clearly, as in this case (not all dogs have four legs), if the premise isn’t true, then the conclusion will be correctly argued but based on false premises (and thus invalid).
§
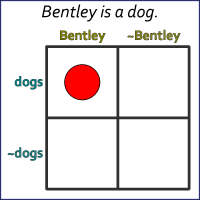
Figure 9. Bentley is a dog.
Figure 9 shows a related proposition from the same universe of discourse. This proposition asserts that there is (at least one) object with the property Bentley, and that object also has the property dog.
Formally we’re saying, “some things named Bentley are dogs“ (without saying all things named Bentley are dogs or that all dogs are named Bentley). A red marker only means there is at least one instance of this case that’s true.
(Of course, there can be more than one dog named Bentley. There almost certainly is.)
As thinking beings, it’s pretty obvious in such a simple case that Bentley, being a dog, has four legs, but we’d like a way to do that within the rules of the logic game. And we’d like a formal grounding to prove our logic. There may be more complicated cases that aren’t as obvious.
§
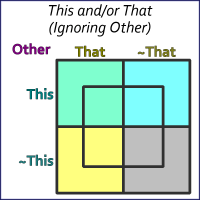
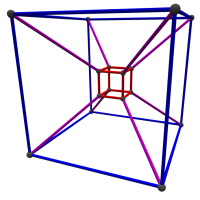
Figure 10. A trilateral diagram.
Carroll introduces what he calls a trilateral diagram (he calls the four-square diagram we’ve been using up to now a bilateral diagram).
Figure 10 shows a basic trilateral diagram, which adds an inner square.
The four quadrants from before are now divided by the line forming the inner square. These still have the meaning they did before in terms of combinations of the properties This and That.
Besides the new inner square, another addition is the name of a third logical property, Other (in the upper left of the diagram). This allows the diagram to combine three properties, This, That, and the Other, from two propositions if there is a common property. To be linked one property must appear in both propositions.
§

Figure 11. The third property.
The third property is true in the four outer parts of the diagram and false in the inner four.
In Figure 11, the four purple areas are all Other=true while the four gray areas are all Other=false.
Adding the inner square divided the four squares into eight areas, the number needed to express all possible combinations of three true/false properties (exactly the same as how three bits has eight combinations). See below for all eight combinations.
As an aside, there are some attractive but increasingly complicated ways of combining three and more logical properties in Venn diagrams. Carroll answered this with ways of subdividing the square for additional properties. It makes for an interesting intellectual and artistic enterprise, but the practical value is questionable.

Figure 12. Putting it together.
In any event, with a trilateral diagram we now have eight places for markers. Figure 12 shows them all in color-coded form. In the following list, the true/false values apply to This, That, and the Other, respectively.
- White: true–true–true
- Blue: true–false–true
- Orange: false–true–true
- Purple: false–false–true
- Green: true–true–false
- Cyan: true–false–false
- Yellow: false–true–false
- Black: false–false–false
Note that the cyan, yellow, and purple mark spots where only one of the three properties is true. Also, that the black marks the spot where none are true, and white marks the spot where all are true.
§
Now we can return to Bentley the dog and dogs with four legs. Between the two propositions there is a common property: dogs. So, we really have only three properties: Bentley, dogs, and four legs. Perfect for a trilateral diagram.

Figure 13: Bentley, dogs, and 4 legs.
Figure 13 shows the diagram for our combined propositions. It also shows the last little wrinkle from Mr. Carrol: one of the red markers straddles two areas. This takes a bit of explaining.
To create this diagram, we copy the first diagram (Figure 8) to the inner squares. Recall that this diagram was true without mentioning Bentley, so the four squares in the middle, which represent all things (in our universe) NOT Bentley, must be the same as Figure 8. We’re just restating what we said before.
Now we add the information from the second diagram by considering the outer four squares. But that information is only about Bentley and dogs. It says nothing about legs. So, from that perspective, the columns merge into a single don’t care area. Carroll provides for cases where we don’t care (or don’t know) whether a property is true or not true. In such a case, the red marker straddles the line between the property true/false areas. As the one in Figure 13 does for the 4legs property.
We might think to place two markers, one in each column, but that asserts there is at least one case of [Bentley, dogs, 4legs] and at least one case of [Bentley, dogs, NOT 4legs], and that is not a correct assertion. We can only, at this point, assert there is at least one dog named Bentley.
§
For the final step we collapse the trilateral diagram into a bilateral one. We do this by considering quadrants. To survive collapse a quadrant must have matching markers in both inner and outer parts.
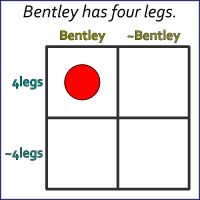
Figure 14. Bentley has 4 legs.
In Figure 13, the upper-left quadrant has a red marker in the inner part and the outer part shares a red marker across two quadrants. This counts as a match. No other quadrants have matching markers, so, as shown in Figure 14, only the red marker the upper-left survives collapse.
We’re left with a proposition of “some X is Y“ form asserting there is at least one object named Bentley with four legs. And since that’s the same Bentley object from Figure 9, we assert that our Bentley has four legs.
[QED?]
§ §
It’s a cute and visual way, a game, to explore and prove syllogisms — logical constructs with two input propositions and one output conclusion. Bit of a change from the Jabberwocky and grinning cats.
Stay logical, my friends! Go forth and spread beauty and light.
∇


October 14th, 2023 at 12:54 pm
Truth tables, have to get those out, from time to time, to solve complex programming problems.
Fun topic. Thanks for the complete explanation.
October 14th, 2023 at 1:20 pm
Thanks, I’m glad you liked it. (I wasn’t sure anyone would. Lots of things I think are fun don’t have wide appeal.)
Yeah, mos def, there are times when one needs to step back and ask what the inputs and outputs are really doing. Long ago, I was into relay-based phone switching systems, and it dawned on me that relay-based control circuits are just giant truth tables. Too big to actually implement that way, of course, so the system implements the table dynamically. But logic tables are super helpful in designing such things on the small scale. [Did you see my post about relay logic?]
October 16th, 2023 at 10:03 pm
Yay, Bentley, our favorite logic game celebrity! Four paws up!🐾🐾
October 17th, 2023 at 9:26 am
Ha! 😂 Well, she’s a very logical dog!
October 17th, 2023 at 10:25 am
I considered a follow-up post, a proper Sideband post, getting more into some case studies (like the song lyric, “thunder only happens when it’s raining”), but decided against it.
One thing I intended to analyze was stoplight logic (putative title: “Square Stoplight Logic”). The final diagram was this:
Which shows the (square) logic of a three-color stoplight. Note that only the red-only, yellow-only, and green-only states are populated. All other states are empty, disallowed. If the light ever enters one of these states, its broken!
In particular, if the light ever enters the lower-right inner state (no red, no yellow, no green), one of its lights is burned out or there is a power failure.