 The Minnesota Twins did not have a good 2025 season. They finished their summer with a 70-92 (.432) record — putting them fourth in the AL Central. A record like that normally means last place in the Division, but the White Sox lost 102 games this year.
Losing 92 games puts this season in a four-way tie with three seasons in recent history: 1983, 1998, and 2014. And now 2025. The tie is for the ninth worst season in franchise history.
Which is weird because the team looked pretty good on paper.
And they certainly had their moments. Our “Twin for life” centerfielder Byron Buxton hit for the first cycle in Target Field history (which goes back to 2010). And he hit a whopping 35 home runs (HR) this season. Not to mention some amazing catches in centerfield.
He had 542 plate appearances (PA) in 2025, which is considerably more than in his previous 10 seasons as a Twin. His second best was 2017 (511 PA), but all other years are below 400 PA. He’s had difficulty staying healthy — he seems a bit injury-prone (because he plays so hard) — so 542 PA in 126 games was nice to see.
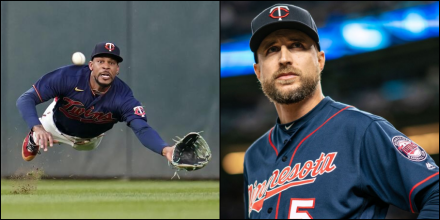
It was not a good season for Twins Manager Rocco Baldelli — the Twins ended up firing him after the season ended.
He was manager for seven years, which is better than the four years Paul Molitor managed them. In contrast, Ron Gardenhire managed for 13 years (the last four of which were among the Twins’ worst seasons), and Tom Kelly (who ushered them to their two World Series wins) managed for 15 years (other of the Twins’ worst years came in his later years with the team — it seems as if some managers wear out).

Dismally, over their history as the Twins (they used to be the Senators), they have 5106 wins with 5183 losses, giving them a franchise record of .496 — not a winning team. It’s visible in the chart above. More years fell below .500 than above it. Their worst year, 2016, is in black. Two runners up for worst, 1981 and 1982, are in gray.
In their best year, 1965, winning 102 games, they got to the World Series but lost to the Dodgers in game seven. (In that series, the home team won in the first six games, but the Dodgers pulled off a game seven win at the Twins’ Met Stadium).
The other big news of the season was the “fire sale” of players to other teams in the July trades. We lost infielders Willi Castro and Carlos Correa; closing pitcher Jhoan Duran; relief pitchers Griffin Jax and Louie Varland; and outfielder Harrison Bader. That was a lot for fans to take in mid-season. Some of those players were very successful for us in past years (Castro and Correa, especially).
As I said above, they looked like a good team, but I think losing all those players at the very least sent an implicit signal of non-support to the team. Regardless, I think the impact is visible. Here’s the team’s win percentage over the season:
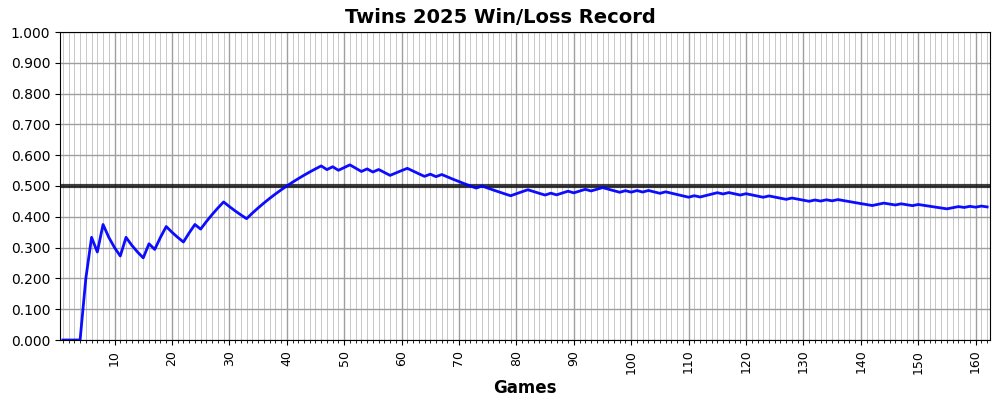
They struggled at the beginning of the season. It took them five games to get their first win, and wins were sparse until May. Starting in game #34 the Twins went on a 13-game winning streak (May 3 – May 17) — the second longest in the MLB this season and the second longest in Twins history. (The Brewers won 14 games in the beginning of August. The Twins won 15 games in the beginning of June 1991.)
By late May they started losing, and by late June they were below .500 never to return to winning territory. They were completely out of contention for postseason by mid-September.
This next chart speaks volumes:
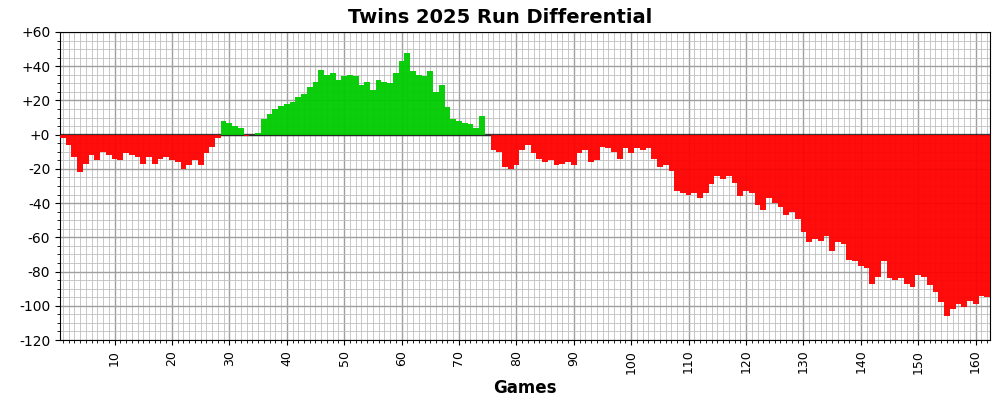
I’ve long been a believer in run differential (between runs scored and runs allowed) as a good indicator of a team. (Obviously, winning games requires scoring more runs.) The chart above shows the same curve as the win percentage chart but signals the problem more intensely (no doubt the green and red help).
The winning streak is apparent — the Twins started scoring runs, delighting us fans. But then they lost their mojo and fell into serious decline. They tried to right the ship and had moments where they reversed the bleeding, but they just weren’t playing good ball in the latter half of the season. It was hard to watch.
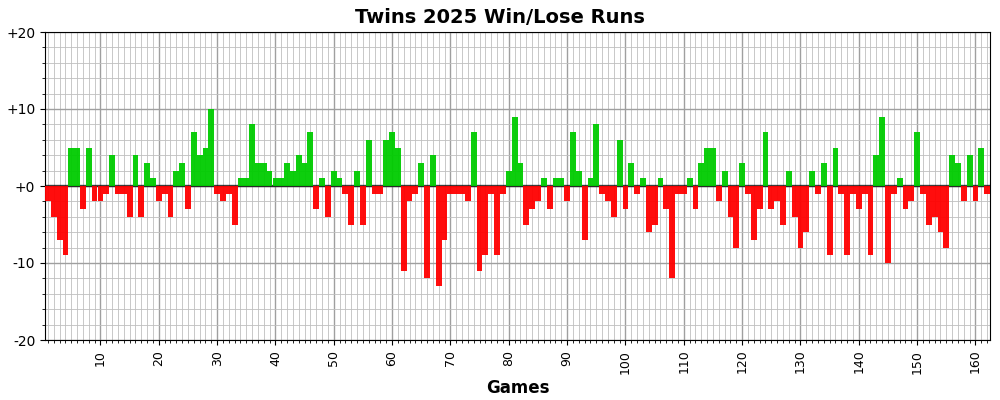
The chart above shows the number of runs each game was won or lost by. If you were to integrate this chart, you’d come up with -95, the final run differential. And there is a bit more red in that chart than green.
It does show how things picked up a little the last week or so of the season. They won four of their last ten games, and while .400 isn’t good, it was better than they had been playing (overall in September they had a .308 win-percentage).
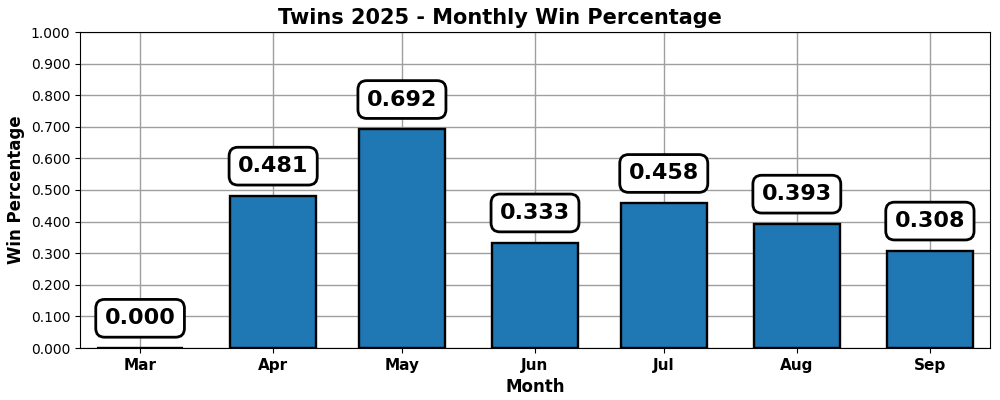
With the exception of May, a seriously losing season. They would have been last in the American League if not for the White Sox. Instead, they ranked 14th (of 15).
They ranked 27th (of 30) in the MLB in 20205. Two National League teams were worse: The Nationals (66-96, .407) and the Rockies (43-119, .265). The Rockies had an especially bad year. The worst the Twins have ever done was losing 103 in 2016.
Going back to runs scored, this chart shows how many runs the Twins scored in each game:
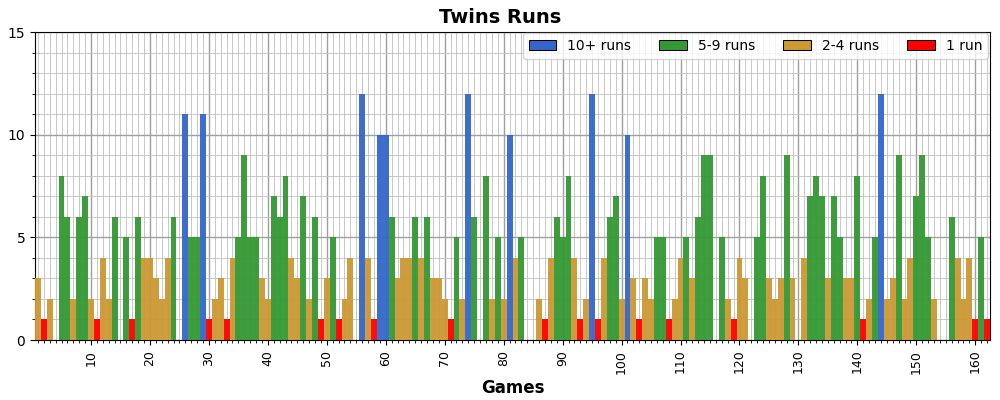
Notice that the Twins never managed to score more than 12 runs in a game.
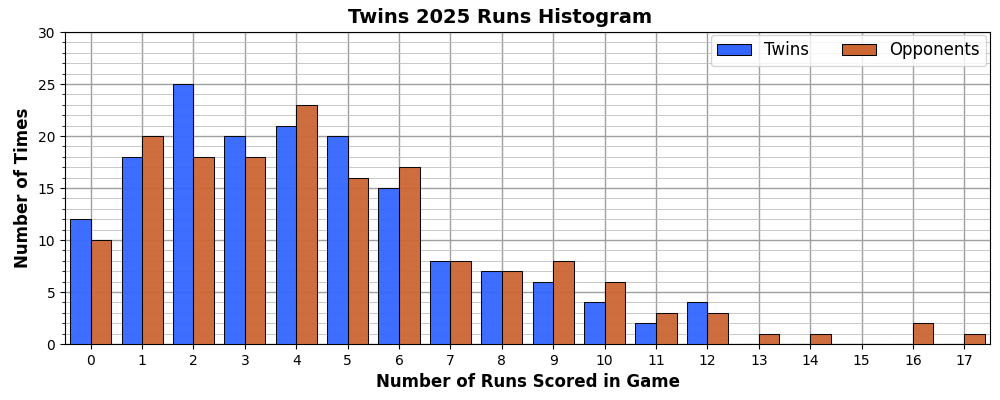
Which they managed to do four times, but their opponents scored as many at 17 against them. Most commonly, they scored only two runs in a game (25 times), and high-scoring games (7+ runs) were rare. Note also that they were shut out 12 times (no runs scored) compared to shutting out their opponents just 10 times.
A histogram of runs-per-inning is interesting:
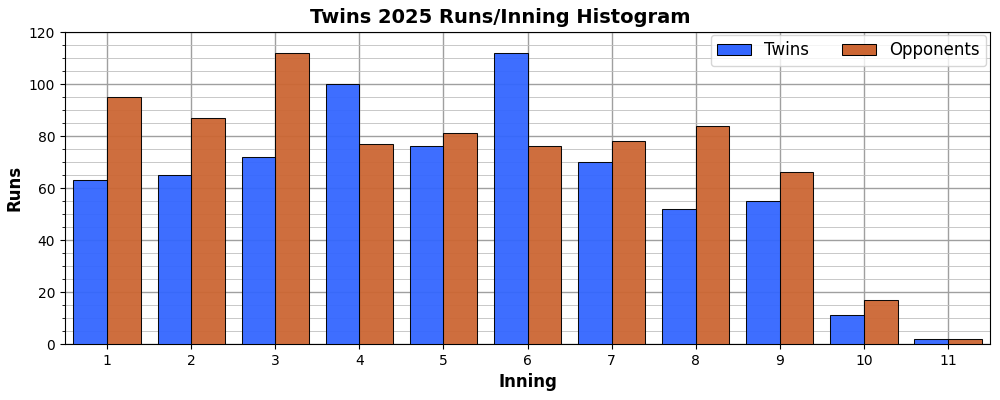
The Twins did much better in innings four, five, and six. Which makes some sense. Those middle innings are when a starting pitcher is starting to get tired, and the team has seen him pitch for three innings.
The sixth inning is when a starter is near the end of their stint. Or it’s when the starter has already been taken out and the Twins are facing a new pitcher from the bullpen. I’d guess more for the former, because the last three innings don’t show a lot of runs, which argues against it being the bullpen.
Speaking of pitching, one reason the team looked like they were contenders this season is that our pitchers struck out many and walked relatively few. Twins starters had a 22.5% strikeout rate against a 6.8% walk rate — striking out 3.3 times as many as they walked. Overall, Twins pitchers struck out 3.0 times as many as they walked (22.4% K rate and 7.5% BB rate).
Which was nice to see. It was something they struggled with during the 2010–2019 seasons when I was paying close attention (and writing many posts about the Twins).
Our key starters, Pablo López, Joe Ryan, Simeon Woods Richardson, Zebby Matthews, and Bailey Ober, had generally decent seasons, especially López, Ryan and Woods Richardson.
| Name | IP | ERA | WHIP | H% | ER% | BB% | K% | HR% |
|---|---|---|---|---|---|---|---|---|
| López | 75.2 | 2.74 | 1.11 | 20.5 | 7.4 | 6.4 | 23.4 | 1.9 |
| Ryan | 171.0 | 3.26 | 1.03 | 19.9 | 9.0 | 5.7 | 28.2 | 4.1 |
| Woods-R | 111.1 | 4.04 | 1.27 | 20.2 | 10.6 | 9.8 | 22.7 | 4.0 |
| Matthews | 79.1 | 5.56 | 1.49 | 26.6 | 13.8 | 6.8 | 24.9 | 3.8 |
| Ober | 146.1 | 5.10 | 1.30 | 25.5 | 13.3 | 5.0 | 19.2 | 4.8 |
Very nice strikeout rates, especially compared to the low walk rates. And fairly low ER and HR rates (Earned Runs and Home Runs). Matthews and Ober gave up too many hits, though, and it’s reflected in their ER rates.
But the season ERAs for López and Ryan are outstanding, and Woods Richardson’s isn’t too bad. I think Ryan started to wear out a bit at the end (171 innings pitched!) — his stats got a bit worse, and he had a couple of bad outings. He was our ace pitcher early in the season.
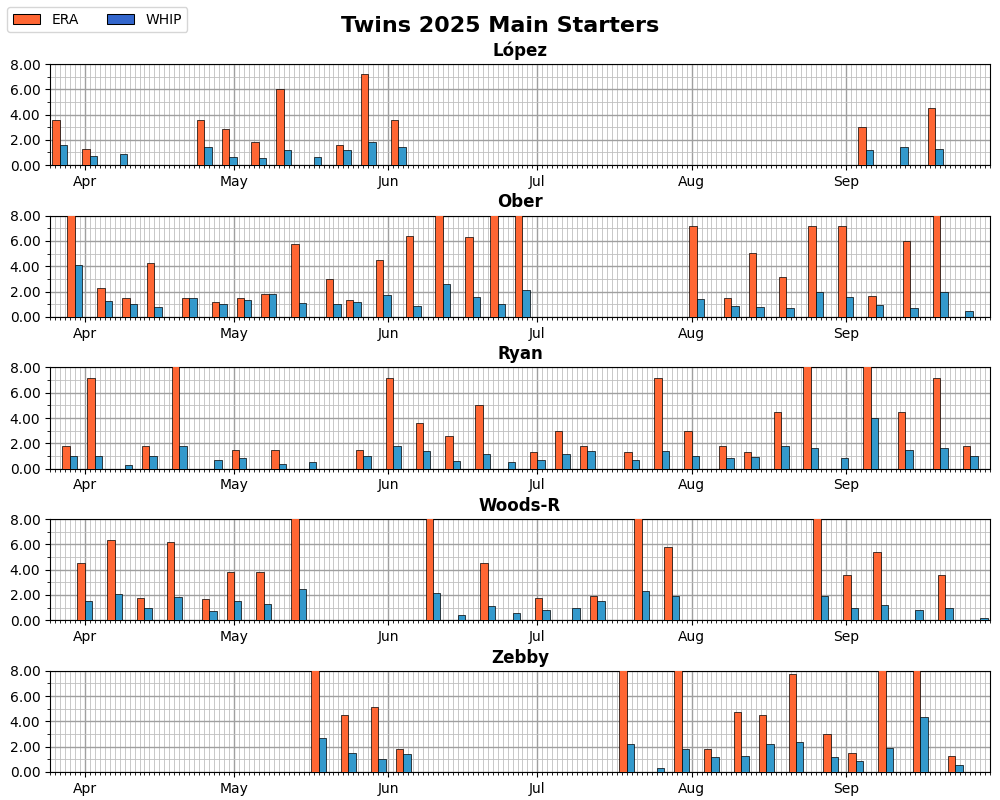
The chart above shows the game ERA and WHIP for those key starters. Most notable is the big gap for López between June 3 and Sept 9 (injured shoulder). In fact, everyone but Ryan (our workhorse pitcher) had injury-related gaps. We saw a lot of different starters over the season because of that, including four times we had collective starts using the bullpen.
FWIW, the league average for giving up home runs is 3.1%, and our pitchers, except López, are all giving up more. OTOH, the league average for strikeouts is 22.2%, and our pitchers tend to be better than average there. League average for walks is 8.4%, and our pitchers, except for Woods Richardson, generally walk fewer.
Bottom line in my book, Twins pitching was finally fun to watch. I don’t know what it was like from 2020 to 2024, but from 2010 to 2019, it was often frustrating to watch. (One of these days, I should dig into all that a bit deeper.) If nothing else this season, I saw some good pitching from the home team.
Two last charts. Both feature rolling averages with a ten-game window. Note that good stats on one chart are bad stats on the other. For instance, lots of strikeouts are good for pitchers but bad for batters. Conversely, lots of hits are good for batters but bad for pitchers.
First, Twins pitching over the season:
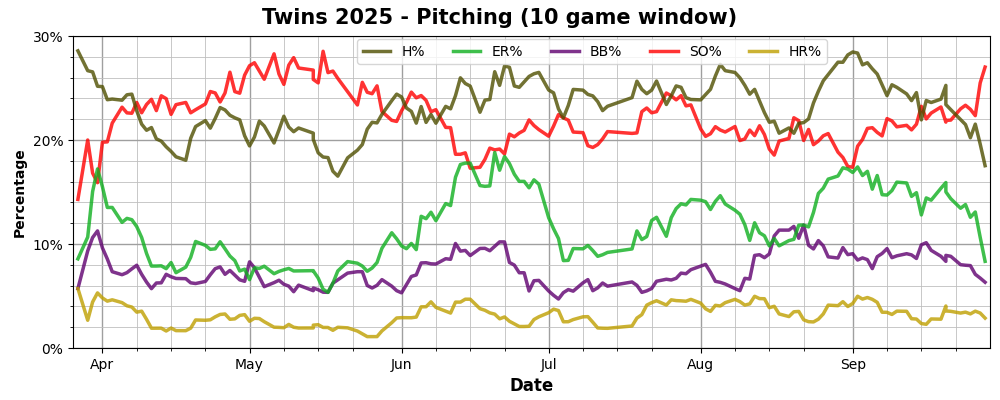
Note how in June the hit, run, and walk rates increase and strikeout rate goes down. With a few exceptions, the hit rate never dropped. The strikeout rate was high the first two months but dropped in June to never really recover. They got earned runs more-or-less under control July and August, but it went up in September.
Here’s Twins batting over the season:
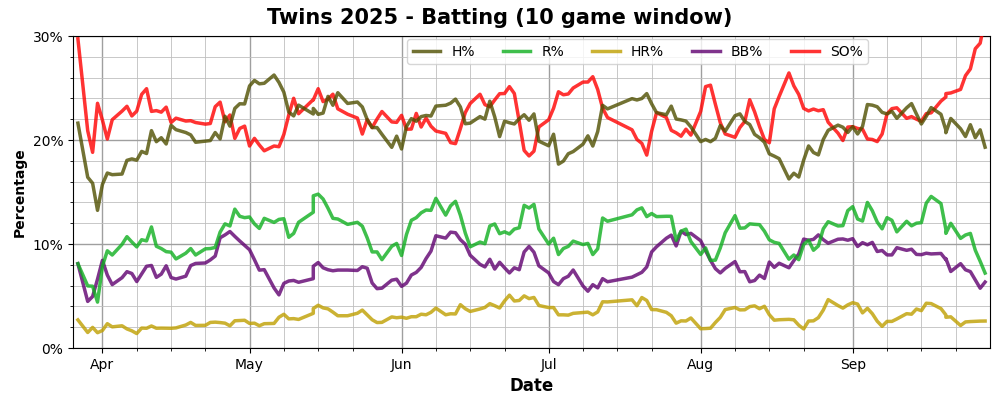
The end of the season stands out for everything falling except strikeouts, which increased. The latter quite a bit. The Twins started flailing at the plate. In contrast, our pitchers improved in the final days of the season.
Looking at the numbers:
| PA/BF | H | R/ER | BB | K | HR | |
|---|---|---|---|---|---|---|
| Batting | 6059 | 1295 | 678 | 495 | 1372 | 191 |
| Pitching | 6116 | 1411 | 721 | 459 | 1372 | 194 |
| Δ | -116 | -43 | +36 | 0 | -3 | |
| Batting | 21.4% | 11.2% | 8.2% | 22.6% | 3.2% | |
| Pitching | 23.1% | 11.8% | 7.5% | 22.4% | 3.2% | |
| Δ | -1.7% | -0.6% | +0.7% | +0.2% | %0.0 | |
(Note that the strikeout percentages differ because the number plate appearances by batters (PA) differs from the number of batters faced by pitchers (BF).)
The differences are not huge, especially in terms of percentages, but they were enough for a losing season. A consistently losing season, save for May.
Ah, well, that’s the Twins for you.
Hopefully, next year will be better. And we’ll see a new manager.
§ §
Stay batting, my friends! Go forth and spread beauty and light.
∇


And what do you think?